Peaks from Dissolved Air in Sample Solvent
HPLC analysis is often plagued by the appearance of peaks of unknown origin (ghost peaks). This is especially troublesome during impurity testing of pharmaceuticals. There are a variety of factors that can cause ghost peaking, but one of the less noticed causes is the presence of dissolved air in the sample solution. This page discusses this in the context of reversed phase separation and UV detection.
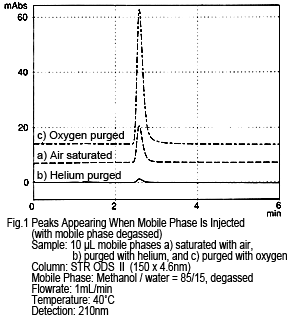
1. Appearance of Peaks Likely Caused by Dissolved Air (Oxygen)
If organic solvents with different types and compositions are used in sample solutions and mobile phases, it is likely that it will result in some sort of peaks. However, in some cases, injecting the mobile phase as the sample solution can produce peaks as well. Furthermore, if the mobile phase is retained and eluted, it makes one wonder what the peak is? One possible cause is a difference in the amount of dissolved air (especially the amount of dissolved oxygen in the case of UV detection).
Figure 1 shows the results from injecting a methanol/water mobile phase mixture directly as the sample, while it is being degassed by online degassing. The concentration of dissolved oxygen was changed and the results compared. If the sample (mobile phase) is injected as-is, in other words still saturated with air, one peak appears (see Figure 1a, where a peak of about 10 mAU occurs from a 10 µL injection). This peak almost disappears if the sample (mobile phase) is injected after purging with helium (concentration of dissolved oxygen is almost zero) (Figure 1b). If purged with oxygen (with a dissolved oxygen concentration about 5 times higher than when saturated with air), the peak size increases. (Figure 1c)
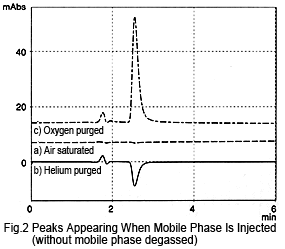
If the mobile phase is not degassed by online degassing, the peak hardly appears at all, even if the sample (mobile phase) is injected saturated with air (Figure 2a). If the sample is purged with helium, a negative peak is observed (Figure 2b).
Based on these results, the peak appears due to a difference in the amount of dissolved oxygen in the mobile phase and sample solution.
2. Peak Size
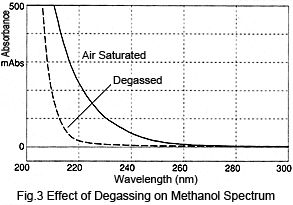
Next, let's consider the size of such peaks. Figure 3 shows a comparison of spectra from air-saturated (no degassing) methanol and degassed methanol. Degassing the methanol reduces absorption1). The difference in absorption varies depending on the wavelength; absorption at 210 nm is over 300 mAU and at 254 nm is about 10 mAU. These values can be used to perform a simple calculation of the peak height after injecting air-saturated methanol to the degassed methanol. When 10 µL is injected at a flowrate of 1 mL/min, assuming a triangular peak with a base 0.4 minutes wide, the peak height at 210 nm would be over 15 mAU and about 0.5 mAU at 254 nm. For shorter wavelengths, this results in rather large peaks.
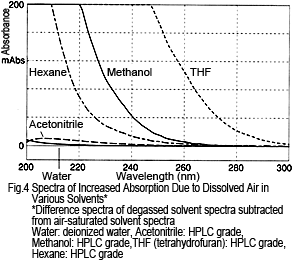
What about other solvents? Figure 4 shows the difference spectra for various solvents, calculated by subtracting the degassed solvent spectra from air-saturated solvent spectra. For each solvent, absorption increases due to dissolved air, but the dissolved air has a smaller effect on water and acetonitrile and a larger effect on hexane, methanol, and THF.
The amount of change in absorption does not match the level of dissolved oxygen in each solvent. For example, hexane has a much higher oxygen solubility than methanol2), but the change in absorption is small. Therefore, the reason for the absorption is not due to absorption by oxygen alone. Rather, presumably it is a result of an interaction between the oxygen and solvent2).
3. Peak Elution Position
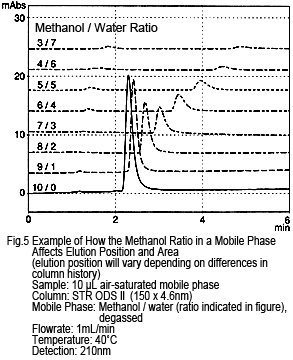
It may be tempting to assume that peaks presumably caused by dissolved oxygen would elute earlier. However, just as with the retention behavior of sample components, decreasing the ratio of organic solvent delays the elution. Figure 5 shows an example of a methanol/water-based solution, where the mobile phase and sample solvent have the same solvent composition. As shown, these peaks might not separate from target components. This same tendency is shown for acetonitrile/water-based solutions or if the water is substituted with a buffer solution.
Note that the peak size decreases as the methanol ratio is reduced.
4. How to Check Peaks Assumed to Be Caused by Dissolved Air
When using a gas-liquid separation membrane degassing unit, if a peak occurs that you suspect is from dissolved air, use the following method to check the peak. If any of the following apply, the probability is very high.
- When the sample solvent and injection volume are the same, the peak appears at approximately the same position and size. To saturate the sample solution with air, use a stirrer (or mix by shaking) or leave it in a semi-open system. If the solution is diluted to inject twice the volume, the area is about 2 times as large.
- The elution time of a peak that appears when mobile phase (saturated with air) is injected, matches the elution time of the suspicious peak. In this case, if the mobile phase is degassed (purged with helium for about 10 seconds) and then injected, the peak becomes smaller.
- When mobile phase is delivered without using a degassing unit and the sample solvent is injected, the peak becomes smaller. If air-saturated mobile phase is injected, the peak always becomes smaller than in case 2. If the composition of the sample solvent is significantly different from the mobile phase, the peak does not necessarily become smaller.
5. Corrective Measures
Though it is difficult to completely eliminate peaks caused by dissolved air, let's consider the following methods to reduce their size (assuming the original analytical conditions use a methanol-based mobile phase).
- Change the mobile phase from a methanol-based to an acetonitrile-based (HPLC grade) mobile phase. When changing the mobile phase, carefully consider the elution strength and separation selectivity3).
→ This is the best method if it is allowed to change analytical conditions. - Reduce the ratio of methanol in the mobile phase. At the same time, select a column applicable to the analysis (shorter column with weaker retention).
→ However, abandoning an ODS column will sacrifice broad applicability and requires technical expertise. - Stop using online degassing.
→ Stopping online degassing could cause problems with air bubbles in flow lines that might make quantitative precision worse or could prevent achieving stable detection1). Therefore, it is not recommended. - Degas sample solutions before injection. Simply degassing with helium for about 10 seconds results in significant degassing.
→ However, the process adds complexity/time and may not be effective for continuous operations.
As a measure to improve separation of target components,
1) Change the elution position of ionic target components by changing the pH level of the mobile phase.
2) Change the type of organic solvent.
These measures should really be considered during method development.
As described above, even if some ghost peaks are judged to be caused by dissolved air, it may be difficult to resolve the problem easily. Nevertheless, it is extremely important for those developing and managing analytical conditions to understand the causes.
Reference Information:
1) LCtalk Special Issue V, Degassing Mobile Phases (1991)
2) S.R. Bakalyar, M.P.T. Bradley and R. Honganen, J. Chromatogr., pp. 158, 277-293 (1978)
3) LCtalk vol. 35, pp. 8-9 (1995)
Postscript:
Even given the same analytical conditions, if a refractometer is being used as the detector, it can cause negative peaks. This is because, when the mobile phase is degassed online, the refractive index is higher than when not degassed.1)Not only oxygen, but nitrogen is involved as well. This will be discussed at a future time, as time allows.


