iMScope QT - Features
Imaging Mass Microscope
Combined Analysis
Fusion of observations from an optical microscope with MS images (exclusive to Shimadzu)
MS images can be obtained flexibly and matched to observation images, either the entire image area or detailed portions of it.
Measurement Results for the Cerebellum with 5 μm Spatial Resolution
- Sample :Whole mouse brain
- Matrix :9-AA
- Measurement region :662×595(393890pix)
- Measurement time: :around 2.2 hours

The region in the red frame below (cerebellum) was measured with a resolution of 5 μm. High-resolution MS imaging and morphological observations with the optical microscope support cutting-edge research.
Measurement Results for Whole Brain Sections in Negative Mode
- Sample:Whole mouse brain
- Matrix :9-AA
- Measurement region: :1126×624(702624pix)
- Measurement time:around 6 hours

The sections of the mouse brain (17 mm × 9.4 mm) were measured at high resolution with a 15 μm pitch (702,624 pixels). The high-resolution analysis of these large brain sections was completed in around 6 hours, enabling testing to proceed efficiently.
Quantification and Distribution
Obtain qualitative and quantitative information from LC-MS as well as position information from mass spectrometry imaging (MSI) with a single instrument.
The combined system, which can perform LC-MS analysis in addition to MSI analysis, provides both distribution information and quantitative analysis.
Use as an MSI System
Sections of mouse tissue administered with chlorpromazine were measured with the iMScope QT. The distribution of unaltered chlorpromazine including differences in abundance could be visualized without the need for labeling.

Use as an LC-MS System
From the consecutive sections, the positions circled in the figure above were excised using laser micro dissection (LMD), and the extracted liquid was measured with LCMS-Q-TOF.
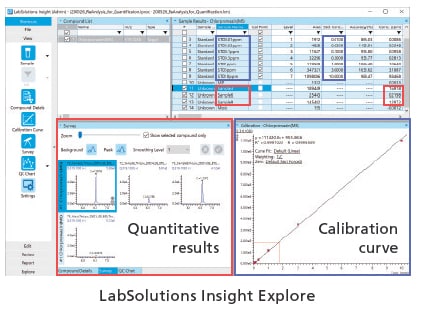
The results below show a quantitative analysis of the concentration of chlorpromazine in the extracted liquid, carried out with LabSolutions Insight™. In this way, concentration differences of the pharmaceutical agent in the tissue sections indicated by MSI could be confirmed from the quantitative results determined using LC-MS.
In addition, it is possible to estimate the molecular formula of an unknown compound using the LabSolutions Insight Explore™ composition estimation function.
In this case, when the peak at m/z = 319.10 determined using MSI was analyzed using the composition estimation function, the molecular formula for the unaltered chlorpromazine substance (C17H19N2SCl) was indicated as the most likely with the highest score.
| Ion Types | Theoretical Value | Measured Value | Difference (mDa) |
| [M+H]+ | 319.10302 | 319.10317 | +0.15 |
Results: highest score of 98.99, Diff. 0.15 mDa (0.458 ppm), C17H19N2SCl
High Resolution, Speed and Accuracy
Acquisition of accurate, high-speed, high-resolution MS images, together with efficient data analysis
Combination of the high-accuracy, high-speed the LCMS-Q-TOF with high-resolution mass spectrometry imaging
Revolutionary, High Performance Analysis System
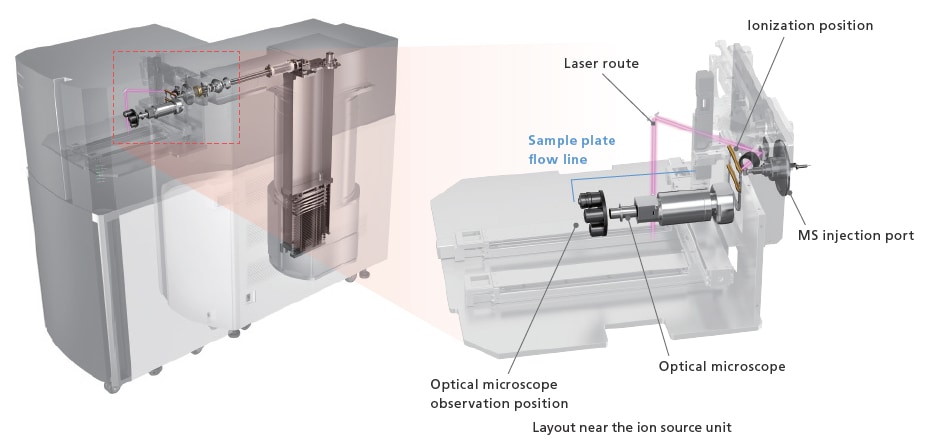
After scanning with the built-in optical microscope, the sample plate is moved directly to the ionization position, and the imaging process begins
Designed for Easy Attachment
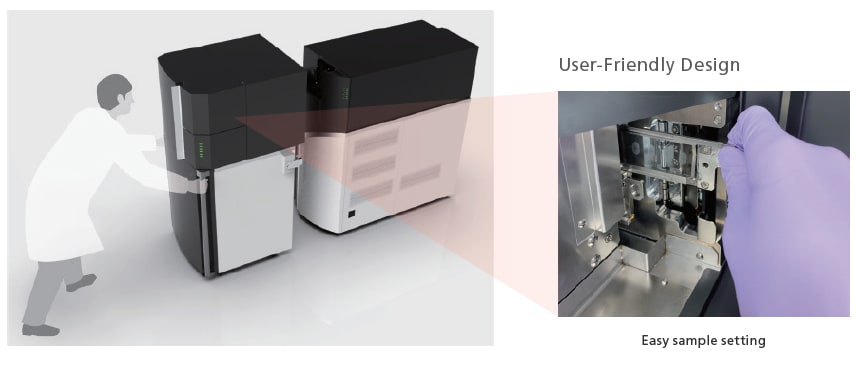
The iMScope QT can be easily attached or detached from the LCMS-Q-TOF to switch between mass spectrometry imaging and high-sensitivity LC-MS analysis.
Effortless Performance for Accurate Mass
Excellence in Mass Measurement Accuracy (MMA)
Mass measurement accuracy (MMA) is the key performance attribute underlying all application fields using high-resolution accurate-mass (HRAM) spectrometers. LCMS-Q-TOF delivers the MMA needed for high-con dence identification of unknown compounds at an unprecedented level of stability. This is made possible by new technologies implemented in the Intelligent Temperature Control System and the UF-FlightTube that accurately offset the changes occurring to both internal and external environments. With LCMS-Q-TOF, Shimadzu aims to totally refashion the HRAM user experience, enabling scientists to run more samples at longer calibration intervals with greater confidence and ease.
Stable MMA Against Temperature Fluctuation
Shimadzu’s Intelligent Temperature Control System ensures stable MMA even in laboratory environments susceptible to temperature changes. To demonstrate, standards ranging from 150 to 1700 Da were analyzed continuously after a single calibration. Normal laboratory temperature fluctuation was observed between 25°C and 28°C.
Without additional mass correction, the measured accurate masses of all compounds remained within 1 ppm of the theoretical mass for the 60-hour duration of the experiment. With the LCMS-Q-TOF, laboratory productivity can be increased by running long, calibration-free batches with confidence.

Multimodal Imaging System
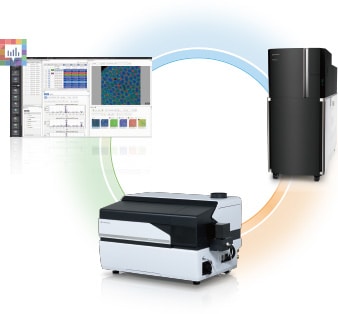
MALDI-MS molecular imaging data and LA-ICP-MS elemental imaging data can be analyzed using a single software solution. That makes multimodal imaging more accessible.
Downloads
Download the latest brochure.


