| Description | Q'ty |
|---|---|
| MICRO-FOCUS X-RAY CT SYSTEM INSPEXIO SMX-225CT FPD HR PLUS MAIN UNIT | 1 |
| MICRO-FOCUS X-RAY CT SYSTEM INSPEXIO SMX-225CT FPD HR PLUS OPRATING UNIT | 1 |
| VGStudio MAX | 1 |
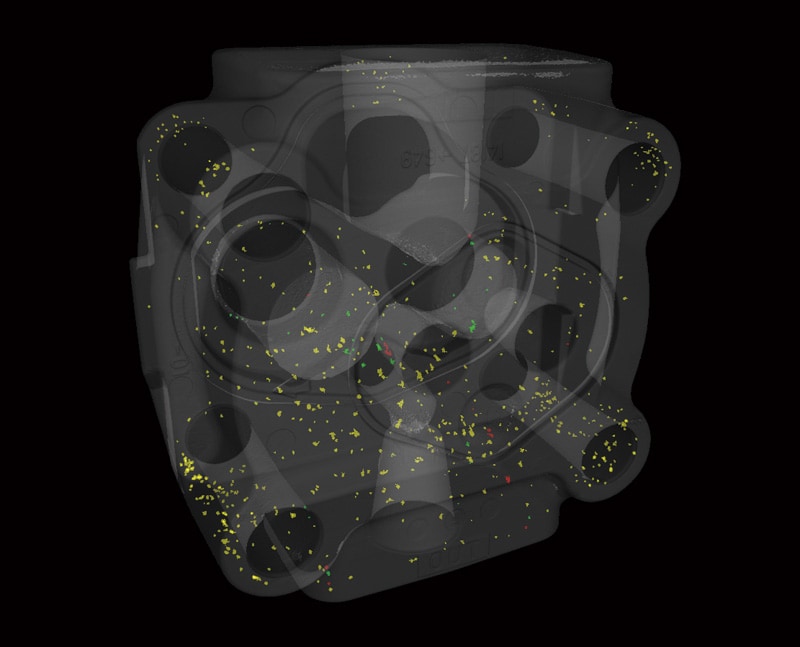
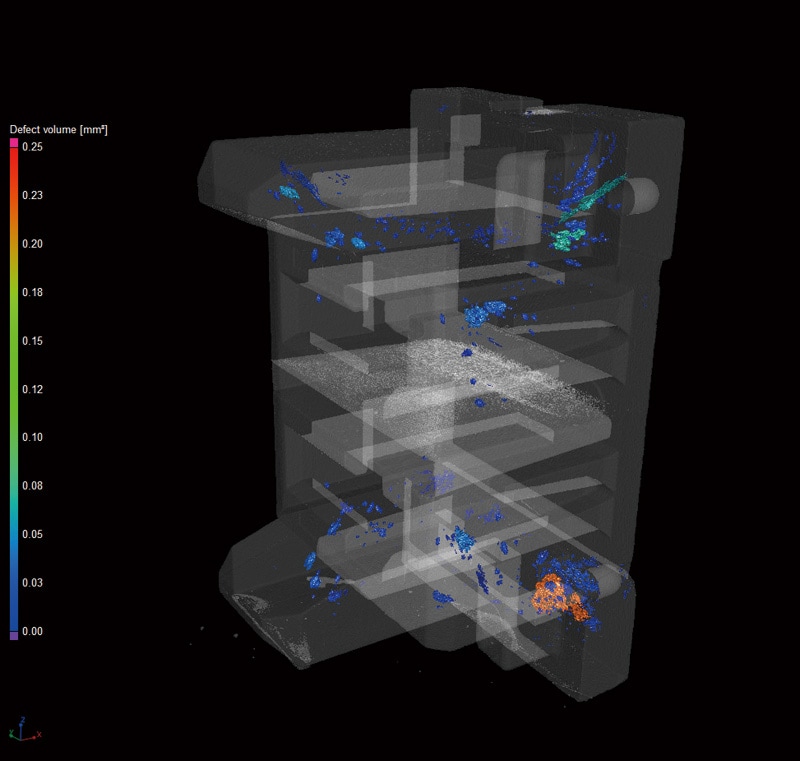
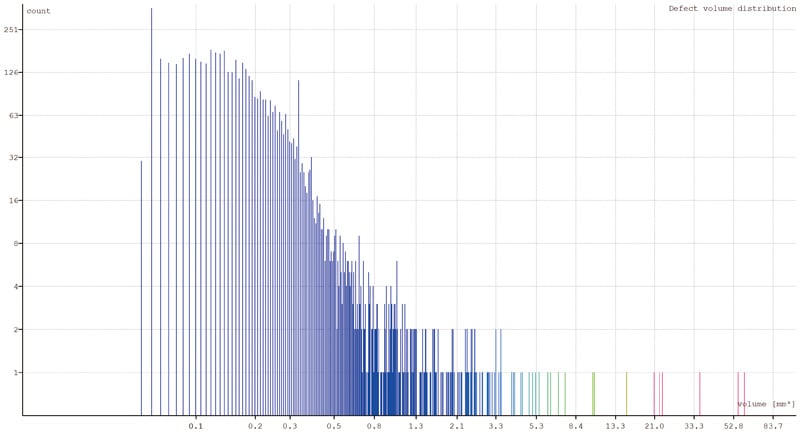
| VGMAX Enhanced Porosity/Inclusion analysis Module | 1 |
| FLAT PANEL DETECTOR,FPD-16.8CL-HvC | 1 |
| HADI-S | 1 |
| Description | Q'ty |
|---|---|
| MICRO-FOCUS X-RAY CT SYSTEM INSPEXIO SMX-225CT FPD HR PLUS MAIN UNIT | 1 |
| FLAT PANEL DETECTOR,FPD-16.8CL-HvC | 1 |
| MICRO-FOCUS X-RAY CT SYSTEM INSPEXIO SMX-225CT FPD HR PLUS OPRATING UNIT 1 VGSTUDIO MAX 3.4 Dongle Licence | 1 |
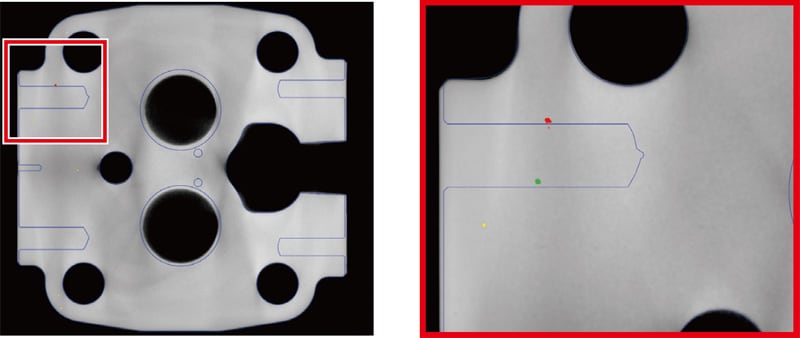
| VGMAX Coordinate Measurement Module | 1 |
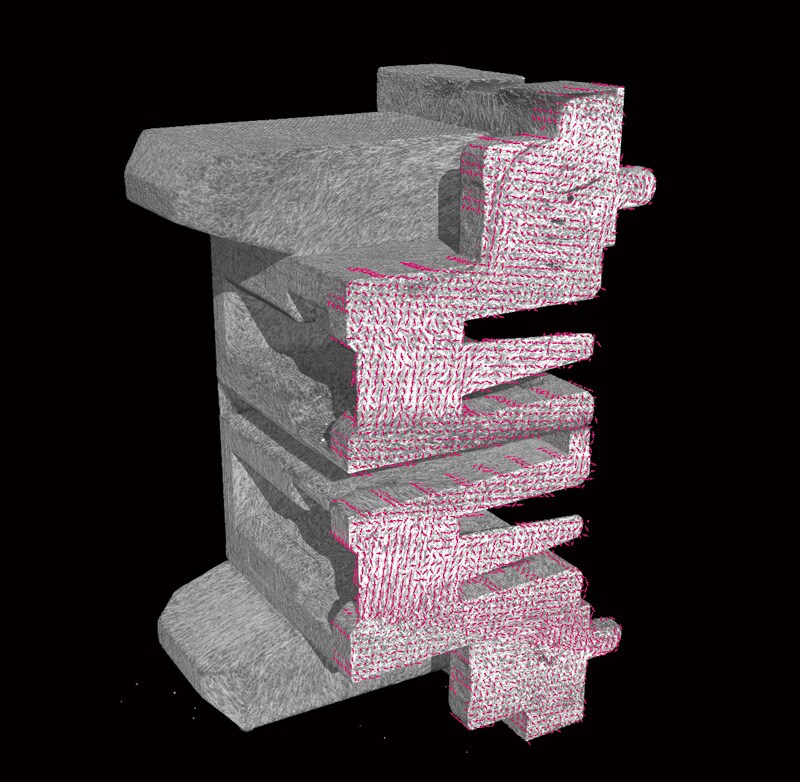
| VGMAX WALL THICKNESS ANALYSIS MODULE | 1 |
| Description | Q'ty |
|---|---|
| MICRO-FOCUS X-RAY CT SYSTEM INSPEXIO SMX-225CT FPD HR PLUS MAIN UNIT | 1 |
| FLAT PANEL DETECTOR,FPD-16.8CL-HvC | 1 |
| MICRO-FOCUS X-RAY CT SYSTEM INSPEXIO SMX-225CT FPD HR PLUS OPRATING UNIT | 1 |
| VGSTUDIO MAX 3.4 Dongle Licence | 1 |
| VGSTUDIO MAX 3.4 VGMAX COORDINATE MEASUREMENT MODULE | 1 |
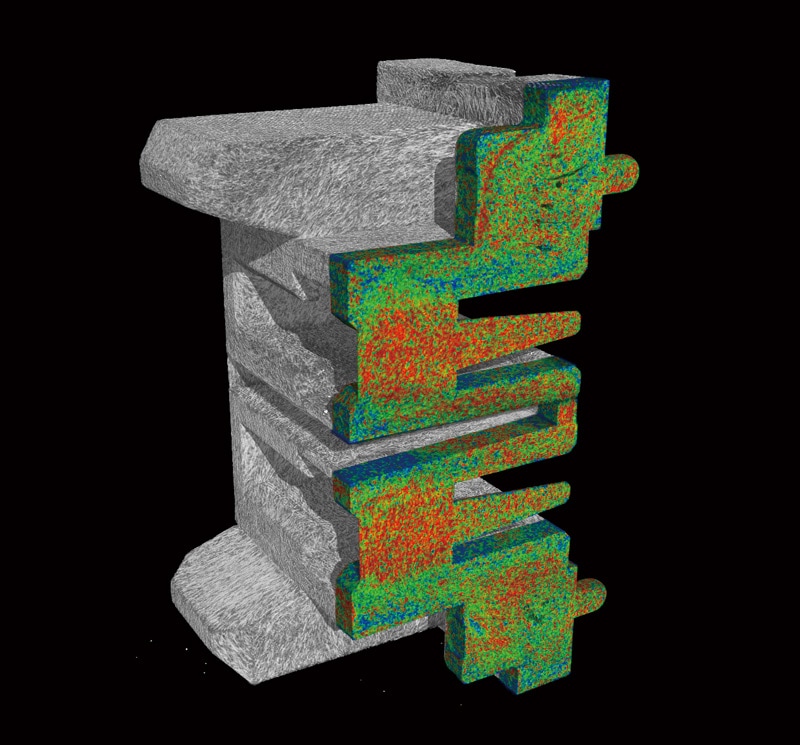
| VGSTUDIO MAX 3.4 VGMAX FOAM/POWDER ANALYSIS MODULE | 1 |
| Description | Q'ty |
|---|---|
| MICRO-FOCUS X-RAY CT SYSTEM INSPEXIO SMX-225CT FPD HR PLUS MAIN UNIT 1 FLAT PANEL DETECTOR,FPD-16.8CL-HvC | 1 |
| MICRO-FOCUS X-RAY CT SYSTEM INSPEXIO SMX-225CT FPD HR PLUS OPRATING UNIT | 1 |
| VGSTUDIO MAX 3.4 Dongle Licence | 1 |
| VGMAX COORDINATE MEASUREMENT MODULE | 1 |
| VGMAX NOMINAL/ACTUAL COMPARISON MODULE | 1 |
| SMXTM-225CT FPD HR Plus | 1 |