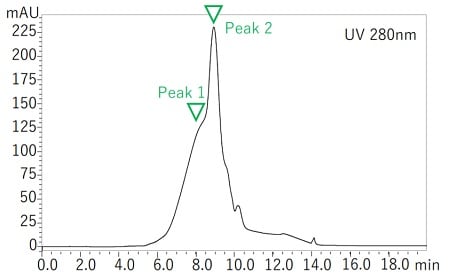
Fig.2 Chromatogram of Protein after human plasma purification
Size exclusion chromatography (SEC) allows compounds to be separated by differences in molecular size.
Fig.1 shows the mechanisms of SEC. The packing material used in the column has many pores. As molecules of various sizes flow through the column, molecules of small size flow slowly while penetrating deep into the pores in the packing material (Fig. 1, right), while molecules of large size flow out of the column without penetrating the pores (Fig. 1, left). As a result, the elution order from the column is faster for larger molecules and slower for smaller molecules. SEC is a separation mode that sieves molecules according to their size. This is the principle of SEC separation.

Fig.1 The mechanisms of SEC
Left : Molecules of “Large” Size
Right : Molecules of “Small” Size
Theoretically, in the absence of chemical interaction, all compounds elute from the column between “exclusion limit” and “permeation limit”. Exclusion limit is defined as the elution volume (retention time) as a large molecule passes through the pores without entering it at all. Permeation limit is the elution volume as a small molecule permeates all pores and elutes.
SEC is also referred to as “Gel Permeation Chromatography (GPC)” or “Gel Filtration Chromatography (GFC)”. Table 1 shows the features of both methods. GPC is a method of measuring the molecular weight distribution of synthetic polymers by using a hydrophobic stationary phase and an organic solvent. GFC is a method of analysis and fraction of hydrophilic polymers (i.e., peptide, protein and polysaccharide) by using a hydrophilic stationary phase and aqueous solution. GFC is also referred to as “Aqueous SEC”.
Table 1 Features of “GPC” and “GFC”
| Method | Target | Stationary Phase | Mobile Phase |
|---|---|---|---|
| Gel Permeation Chromatography (GPC) | Measurement of Molecular Weight Distribution of Synthetic polymers | Hydrophobicity | Non-Aqueous (Organic solvent) |
| Gel Filtration Chromatography (GFC) | Measurement of Molecular Weight Distribution / Analysis and Fraction of Water-soluble Polymers | Hydrophilicity | Aqueous |
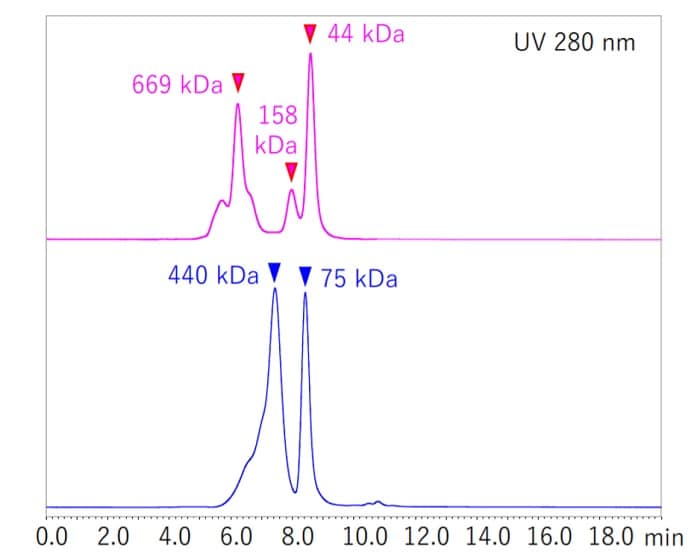
Fig.2 shows the chromatogram of protein purified from human serum sample. To estimate the molecular weight of protein from the peak obtained in Fig.2, a standard solution mixture of water-soluble polymer compounds (Top : Thyroglobulin (669 kDa) , Aldolase (158 kDa) , Ovalbumin (44 kDa) , Bottom : Ferritin (440 kDa) and Conalbumin (75 kDa) was analyzed (Fig.3).

Fig.2 Chromatogram of Protein after human plasma purification

Fig.3 Chromatograms of Water-Soluble Polymer Standard Solution
From the results shown in Fig. 3, it can be seen that the water-soluble polymer compounds are eluted from the column in descending order of molecular weight.
The approximate molecular weight of the purified protein can be calculated by analyzing water-soluble polymeric compounds of known molecular weight as markers and comparing their retention times with the analytical results of Fig. 2.
Reference Application
Link
Related Products
