eMSTAT Solution - Features
Statistical Analysis Software for Direct Ionization Mass Spectrometry
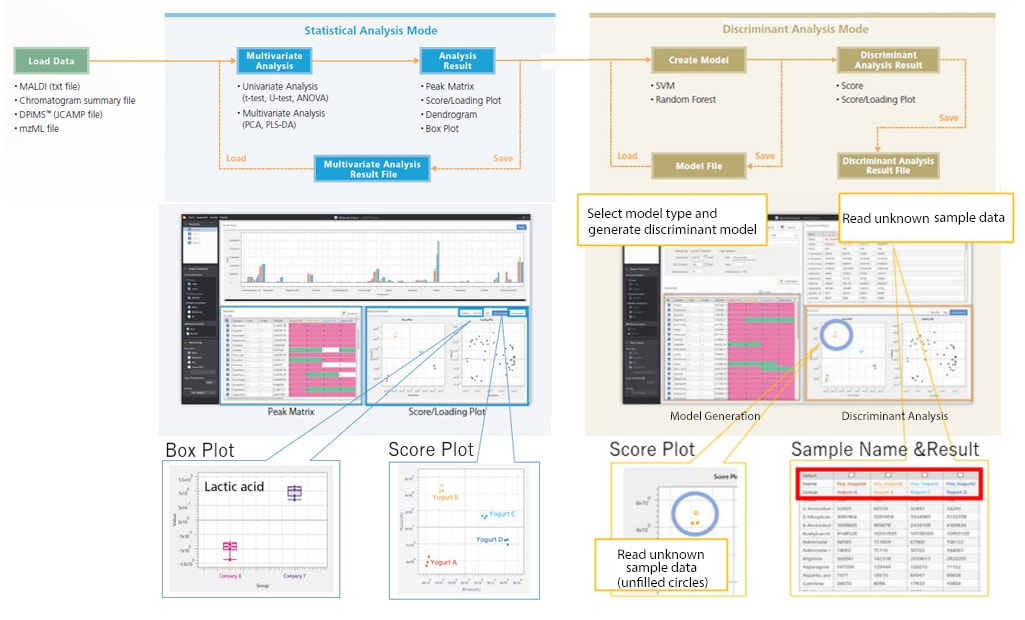
Statistical Analysis Mode for Intuitive Data Analysis Operations
When searching for characteristic sample components, sample differences can be visualized by using principal component analysis (PCA) to comprehensively handle all measurement data and identify inherent differences. After selecting each sample group’s characteristic peaks from the score plot and loading plot, differences between groups can be confirmed via the box plot.
Discriminant analysis of unknown samples can be performed by generating models using known sample data (training data). After generating a discriminant model and reading the unknown sample data, the software then displays the sample groups by data attribute. Users can select Support Vector Machine or Random Forest for the discriminant model algorithm.
Workflow Using eMSTAT Solution
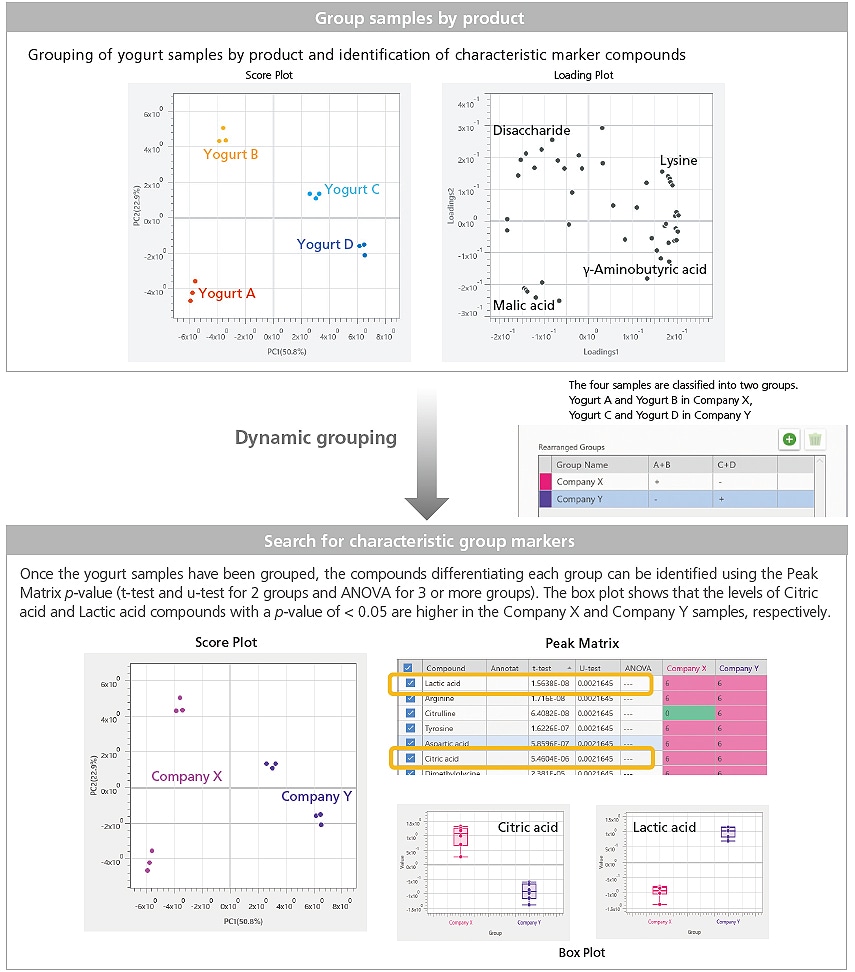
Dynamic Grouping Function for Flexible Sample Grouping
In sample group differentiation, analysis samples can be grouped according to attribute (raw materials, reaction conditions, normal/abnormal, manufacturer, type, etc.) and then searched for characteristic group markers. The eMSTAT Solution software’s Dynamic Grouping Function effectively enables the creation of new sample groups while retaining existing group information.
Analytical Conditions
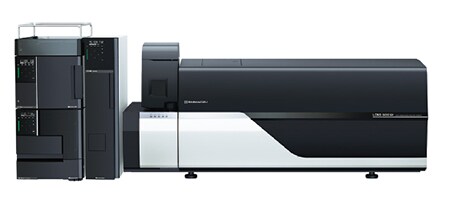
Instrument: LCMS-8045/8050/8060NX
Sample: Commercially available yogurt
Using the ion-pair-free LC/MS/MS method included in Shimadzu’s LC/MS/MS Method Package for Primary Metabolites Ver. 3, the system can comprehensively analyze a total of 153 compounds, including sugars, in addition to hydrophilic metabolites essential for metabolomic analysis, such as amino acids, organic acids, nucleosides, and nucleotides.
Discriminant Analysis Mode Supports Grouping of Unknown Samples
Identifying Degraded Synthetic Polymers
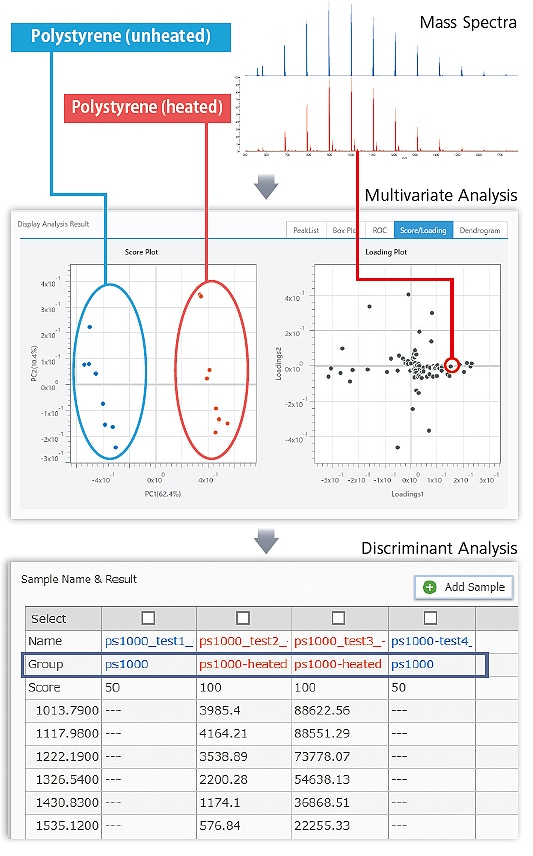
Polystyrene (heated and unheated) polymers were separated into two groups (heated or unheated) by multivariate analysis (PLS-DA) of the MALDI mass spectrum (Score Plot). A Loading Plot can be used to confirm which peaks (marker peaks) affect the differences between the two groups.

Using marker peaks identified by multivariate analysis to create a discriminant model and discriminate between heated and unheated polymers in a polystyrene mass spectrum, obtained separately, resulted in correct discrimination of all polymers. By using eMSTAT Solution in combination with MALDI mass spectrometry, which can easily measure samples with large molecular weight synthetic polymers and a wide variety of other samples, such as protein, fat, or sugar samples, can be easily differentiated.
Easy Differentiation for Beef Classification
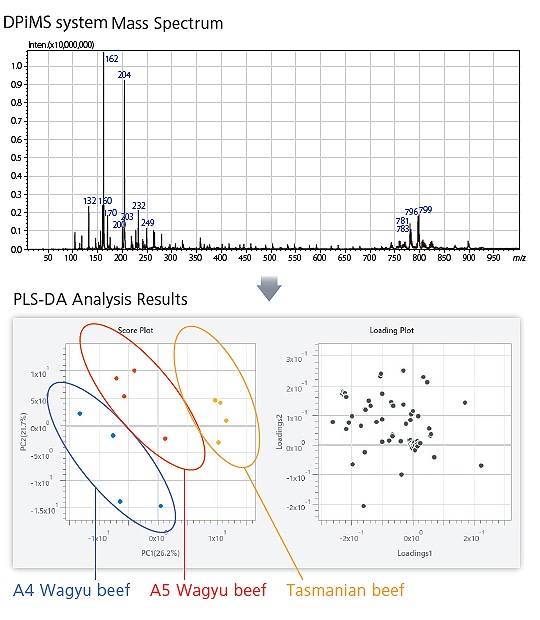
Extracts from commercial beef (Tasmanian and A5/A4 grade Wagyu beef) were analyzed in a DPiMS system mass spectrometer. The resulting spectra were then analyzed by PLS discriminant analysis. A Score Plot confirms grouping into three groups and a Loading Plot confirms which metabolite peaks affect grouping.

With eMSTAT Solution, spectra obtained by convenient metabolite analysis in a DPiMS system mass spectrometer can be used to easily differentiate between differences in food, plant, and other samples, and screen for information about metabolites that contribute to differentiation.
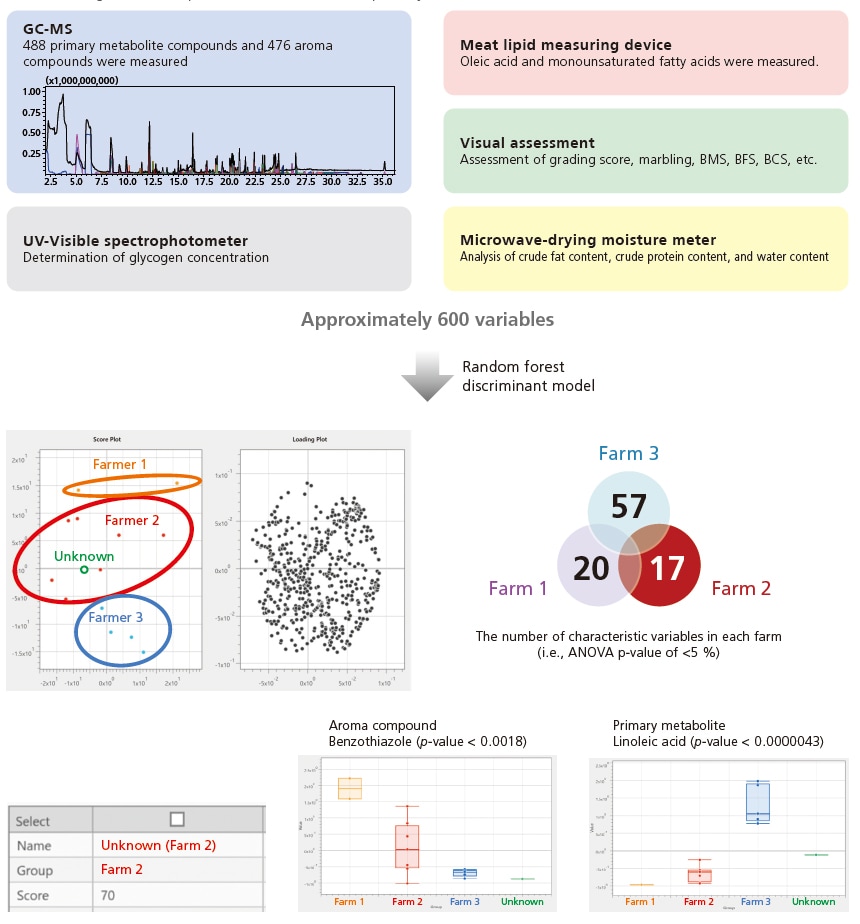
Discriminant Analysis of Beef Meats
In addition to chromatogram and MS spectrum data, the eMSTAT Solution software can read various data formats (JCAMP, ASCII, mzML, etc.), supporting the integrated analysis and multi-faceted assessment of various types of data.
Analytical Conditions
- Instrument: GCMS-TQ8040 NX
- Sample: Beef meat
Using the Smart Metabolites Database Ver. 2, this system is capable of analyzing about. 500 primary metabolites, including organic acids, sugars, nucleic acids, fatty acids, and amino acids. Using the Smart Aroma Database, it can also analyze about. 500 aroma compounds with SPME Arrow.
A discriminant analysis was successfully performed on an unknown meat to determine its farm of origin based on approximately 600 variables (i.e., GC/MS, UV, meat lipid measuring device, microwave-drying moisture meter, and visual assessment). In addition to determining the origin, the discriminant model revealed the characteristic variables of Farmer 2 (e.g., the roast-smelling aroma compound benzothiazole, the primary metabolite linoleic acid).