RF-6000 - Features
Spectrofluorophotometer
High Sensitivity, High Stability and High Speed

■ High-sensitivity measurements can be performed with S/N ratios of 1,000:1 (RMS) or 350:1 (P-P).
■ Improved lower limit of quantitation. Measures concentrations up to 1 x 10-13 mol/L (fluorescein).
A redesigned optical system and signal processing system achieve the highest S/N ratio levels in its class.
Even extremely dilute samples can be measured accurately.
The RF-6000 can measure uorescence spectra from uorescein concentrations as low as 1 x 10-13 mol/L. Furthermore, due to an auto-gain control function that ensures measurements are performed using optimal measurement parameters, the system can perform accurate and highly quantitative measurements over a wide six-order dynamic range, from 10-13 to 10-7 mol/L.


Enables ultrafast scanning at speeds up to 60,000 nm/min. All wavelength regions can be measured in only one second. 3D fluorescence spectra can also be measured quickly.


The Xenon lamp offers long service life and high stability. The 2000-hour service life significantly reduces running costs. In addition, auto alignment technology allows customers to easily replace the lamp without tedious adjustment routines.

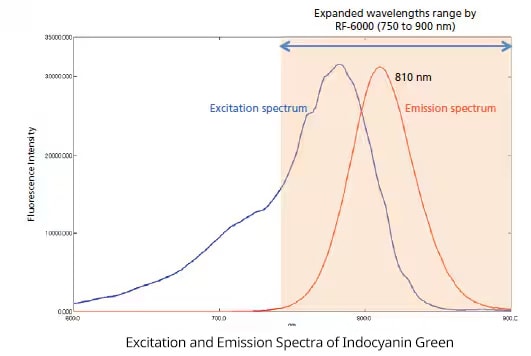
A low-noise photomultiplier is included standard. It offers high measurement sensitivity for long wavelengths. Consequently, it can measure substances that exhibit fluorescence at longer wavelengths, such as chlorophyll and indocyanin green (ICG). Below are Excitation and Emission spectra of indocyanin green, which is used for testing hepatic function and hepatic spare ability.
Fluorescence Spectrum of Thylakoid Membrane Solution Cooled by Liquid Nitrogen
Videos
LabTube Meets Mark Talbott, Shimadzu
LabTube Meets Mark Talbott, Shimadzu at Pittcon 2015, New Orleans. In this video Mark introduces Shimadzu's new RF-6000 fluorescence spectrophotometer.

How to register a new spectrometer, how to collect a 2D spectrum and how to collect a 3D spectrum.
Included in this video are how to register a new spectrometer, how to collect a 2D spectrum and how to collect a 3D spectrum.