Qualitative and Quantitative Analysis by ICP-MS
Basics of Inductively Coupled Plasma Mass Spectrometry
1. Qualitative Analysis
Ions separated in the quadrupole mass spectrometer by m/z are scanned from low to high mass at high speed. A mass spectrum is generated with ion intensity on the vertical axis and m/z on the horizontal axis, referred to as a total mass profile or mass spectrum (Figure 1). This total mass profile acts as a rapid qualitative analysis performed for each sample. In this, the full available mass range that contains all sample elements (m/z=5 to 260) is output as the total mass spectrum. The ion intensities shown in the total mass spectrum can also be used together with database sensitivity coefficients to obtain semi-quantitative data.
Ideally, all elements in the sample become singly charged ions and typically appear at the same m/z as their isotopic mass number. However, this spectrum will also pick up other elements at the same mass number (isobaric interference), doubly charged ions, as well as polyatomic clusters at an equivalent m/z. The mass profile can be used to help look for and identify not only the elements and their approximate concentration in the sample, but also potential mass interferences (Figure 2).
Scan the mass range of all elements
→ Check for elements of interest
Check for spectral interference

Figure 1: Total mass spectrum from 5 to 260 m/z

Figure 2: Semi-quantitative data: checks the approximate concentrations of elements
2. Quantitative Analysis (Calibration Curve Method)
Quantitative analysis is performed on a single isotope or set of isotopes as specific mass-to-charge ratios (m/Z). The mass number of each is chosen in advance and analysis is performed at longer integration times than with qualitative analysis. A set of standard solutions of known concentration are prepared and analyzed, which result in a calibration curve that ion intensity (cps) on the vertical axis and concentration on the horizontal axis by the least squares method. Next, an unknown sample is analyzed, and the detected ion intensity is converted to concentration based on the relationship established by the generated calibration curve equation (Figure 3). Since ICP-MS is also capable of analysis of multiple elements in a single mass sweep, when intending to measure multiple elements in a sample, a mixed standard solution can be used to create calibration curves to set up for all the elements required gathered concurrently in a single run.
Table 1: Example of a calibration curve matrix. Standard should be made to bracket samples.
| STD1 (µg/L) |
STD2 (µg/L) |
STD3 (µg/L) |
STD4 (µg/L) |
Unknown sample (µg/L) | |
|---|---|---|---|---|---|
| As | 0 | 0.5 | 1 | 2 | ? |
| Se | 0 | 0.5 | 1 | 2 | ? |
| Cd | 0 | 0.2 | 0.4 | 0.8 | ? |
| HNO3 | 1% | 1% | 1% | 1% | 1% |

Figure 3
Quantitative analysis by the calibration curve method determines analyte levels by comparing the ion intensities measured in the test sample with those of a standard solution of known concentration. For accurate results, the matrices (e.g., physical and chemical properties) of the standard solution and unknown test sample must be as closely matched as possible to mitigate any variance in measurement between calibration curve measurements and sample measurements. For example, if acid is added to a sample to stabilize the analyte elements, the same concentration of acid should be present in the standard solutions and unknown samples.
3. Quantitative Analysis (Internal Standard Method)
The internal standard method employs the same technique of calibration curve method but adds a specific element at the same concentration to all standard samples and unknowns. This method uses measurements of this specific element as an internal standard element to correct for matrix-induced differences in measurement sensitivity between the standard sample and unknown sample.
A calibration curve is created with the ratio of the ion intensity of the analyte element (IS) to the internal standard element (IR) on the vertical axis (IS/IR). Because the internal standard element should experience the same variation in sensitivity as the analyte element, the intensity fluctuations that occur can be normalized and thus accounted for. An element with a mass number close to the analyte element is typically chosen as the internal standard element. Ideally, the internal standard should also have the same chemical behavior as the analyte of interest and a similar first ionization potential energy. The internal standard method also corrects for fluctuations in sensitivity caused by changes in the equipment over time; for this reason, the internal standard method is typically preferred over the calibration curve method for quantitative analysis by ICP-MS.
| STD1 (µg/L) |
STD2 (µg/L) |
STD3 (µg/L) |
STD4 (µg/L) |
Unknown sample (µg/L) | |
|---|---|---|---|---|---|
| As | 0 | 0.5 | 1 | 2 | ? |
| Se | 0 | 0.5 | 1 | 2 | ? |
| Cd | 0 | 0.2 | 0.4 | 0.8 | ? |
| HNO3 | 1% | 1% | 1% | 1% | 1% |
| Ga (Internal standard) | 5 | 5 | 5 | 5 | 5 |
| In (Internal standard) | 5 | 5 | 5 | 5 | 5 |

Figure 4
E.g.: Intensity ratio for Cd (m/z = 111) = Ion intensity of Cd (m/z = 111) / Ion intensity of In (m/z = 115).
Similarly, Se (m/z = 78) and As (m/z = 75) measurements are corrected using Ga (m/z = 71), which has a similar mass number.
Criteria for Internal Standard Element Selection
- The internal standard element is not present in the sample (content is very small compared to amount added)
- Internal standard element behaves the same as the analyte element (elements with similar mass numbers and ionization energies are more likely to have matching behaviors)
- Not affected by spectral interference from the analyte element or co-existing elements
- Does not cause spectral interference over the analyte element
- Measurement sensitivity is adequate for a reasonable added amount
- Does not contaminate the analyte element (use a high-purity standard solution) Note: Be, Co, Ga, Y, Rh, In, Te, Tl, and Bi are often used as internal standard elements after confirming the above criteria are met.
4. Basics of Creating a Calibration Curve
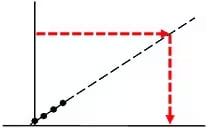
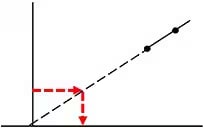
ICP-MS analysis is normally performed using a first-order (linear) calibration curve. For quantitative analysis, calibration curve samples are prepared so the analyte concentration of the unknown sample is within the concentration range of the resulting calibration curve. When the analyte concentration of a test sample is substantially above or below the upper or lower range of the calibration curve, errors can arise as the linearity of the calibration curve is not guaranteed in these regions.
-
Good:
Measurement is within the concentration range of the calibration curve -

-
Not good:
Measurement substantially exceeds the upper concentration range of the calibration curve 
-
Not good:
Measurement substantially exceeds the lower concentration range of the calibration curve -

Since ICP-MS can perform the analysis of multiple elements in a single run, calibration curves can also be prepared from a mixed standard solution of multiple elements. Preparation of these mixed standard solutions is not insignificant. For example, Ag precipitates in the presence of hydrochloric acid as insoluble AgCl. However, tin (Sn) is stabilized with hydrochloric acid. Therefore, a solution with both Ag and Sn requires special attention. Standard solutions can also contain dissolved salts not indicated or reagents added for stabilization. To prevent contamination or precipitation, it is important to check in advance what acids are added to each standard solution and what salts were dissolved to create each standard solution. This is even more prevalent when preparing and checking samples. It is important to match sample matrix to standard as closely as possible.
Key points for standard solution preparation
- When mixing standard solutions, ensure the reagents and elements in each standard solution do not form a precipitate when combined.
- Do not use element combinations that result in spectral interference at the measured mass number.
- Calibration curves should be prepared from at least four data points.
- Match the major components (e.g., acids and acid concentration, dissolved salts, major elements in solution) to create a matrix match between samples and standards.


