LabSolutions Insight Biologics - Features
Software for Oligonucleotide Sequence Characterization
Structural Formula Display
In the window for setting the oligonucleotide sequences,the structural formula of the sequence that was entered is displayed in real time, enabling quick and easy verification of the information. Also, the nucleobases used in the sequence, as well as the backbone linker, ribose, and base modifications, can be added and edited.

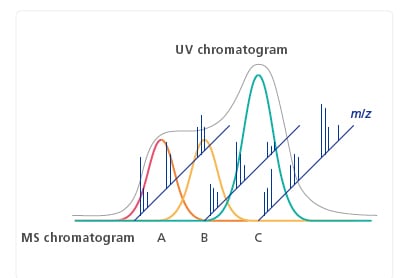
Component Chromatogram Display
The impurity peaks are displayed as a component chromatogram. The UV and MS chromatograms can be checked simultaneously.

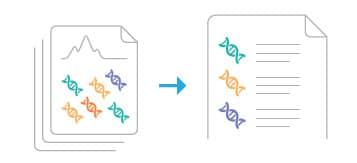
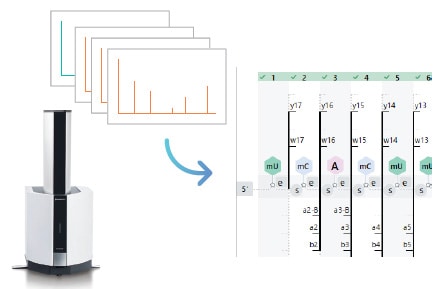
Fragment Coverage Display
The software includes a coverage display which indicates fragment spectral assignments. The coverage display switches to match the items to be checked. Reports can also be output.

A Superior User Experience
-
LC Based Purity Calculations
Using the peak information from the MS spectrum simultaneously with the integrated LC chromatogram peaks enables purity calculations even for components that are insufficiently separated in the LC chromatogram.
-
Fragment View Function
The software includes a coverage display, which indicates fragment spectral assignments. The coverage display switches to match the items to be checked. Reports can also be output.
-
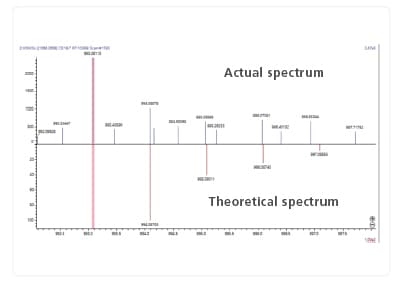
Optimization of Identification Results
Given the complex nature of synthesizing oligonucleotide therapeutics Insight Biologics is designed to positively identify each product related component with high confidence.
-
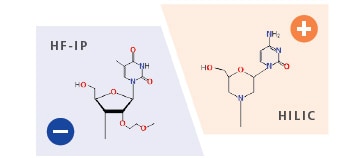
Analysis Functions for Each Ionization Polarity
By supporting both positive and negative ionization modes it enables data analysis using ion pair reagents in negative ion and HILIC separations in positive ion (for example analyzing morpholino nucleic acid in positiveion).
-
Efficient Analysis of MALDI Spectra
With MALDI-MS, the data analysis algorithm has been optimized for a nominal mass univalent spectrum to deliver synthesis and sequence confirmation. The underlying workflow is common to both MALDI and LC-MS instruments providing the same user experience and data presentations negating the need for instrument specific training in data analysis.
-
Component Comparison Functions
The identification results within one sample and for each batch row can easily be compared.

Data Integrity Support
LabSolutions Insight Biologics contributes to heightening workflow efficiency while managing data in accordance with the guidelines in U.S. FDA 21 CFR Part 11, the Japanese edition of the ER/ES Guidelines, and the EU GMP Annex 11.
(Compliance-ready support for LCMS-SQ and LCMS-Q-TOF with LabSolutions CS)