We are pleased to announce that the LAMS-50K laser ionization mass spectrometer, for which Shimadzu started research and development at the Central Research Laboratory in 1984 and which was launched in 1988, has been recognized as an IEEE Milestone by the Institute of Electrical and Electronics Engineers (IEEE). This recognition honors significant technological achievements at least 25 years after their introduction. The LAMS-50K was honored for being the world's first commercially available device that applied soft laser desorption ionization techniques, leading to new pharmaceuticals and diagnostic capabilities in the fields of molecular biology and medicine. Press Release
Koichi Tanaka, who was deeply involved in this development from the start, explains each element of the technology in the device.
Koichi Tanaka
The LAMS-50K, recognized as IEEE Milestone, incorporated not only the Soft Laser Desorption technique, which won the 2002 Nobel Prize in Chemistry, but also several of the most advanced technologies of the time. These technologies and fundamental principles have been continuously improved with various ideas by researchers and engineers around the world, leading to a significant performance improvement in current Time-of-Flight Mass Spectrometric (TOF-MS) techniques.
On the occasion of this recognition, I will take this opportunity to reflect on its significance and explain each of the technologies implemented in the commercialization of the LAMS-50K.
Paper on Nobel Prize Lecture (Nobel Lecture)
https://www.nobelprize.org/uploads/2018/06/tanaka-lecture.pdf
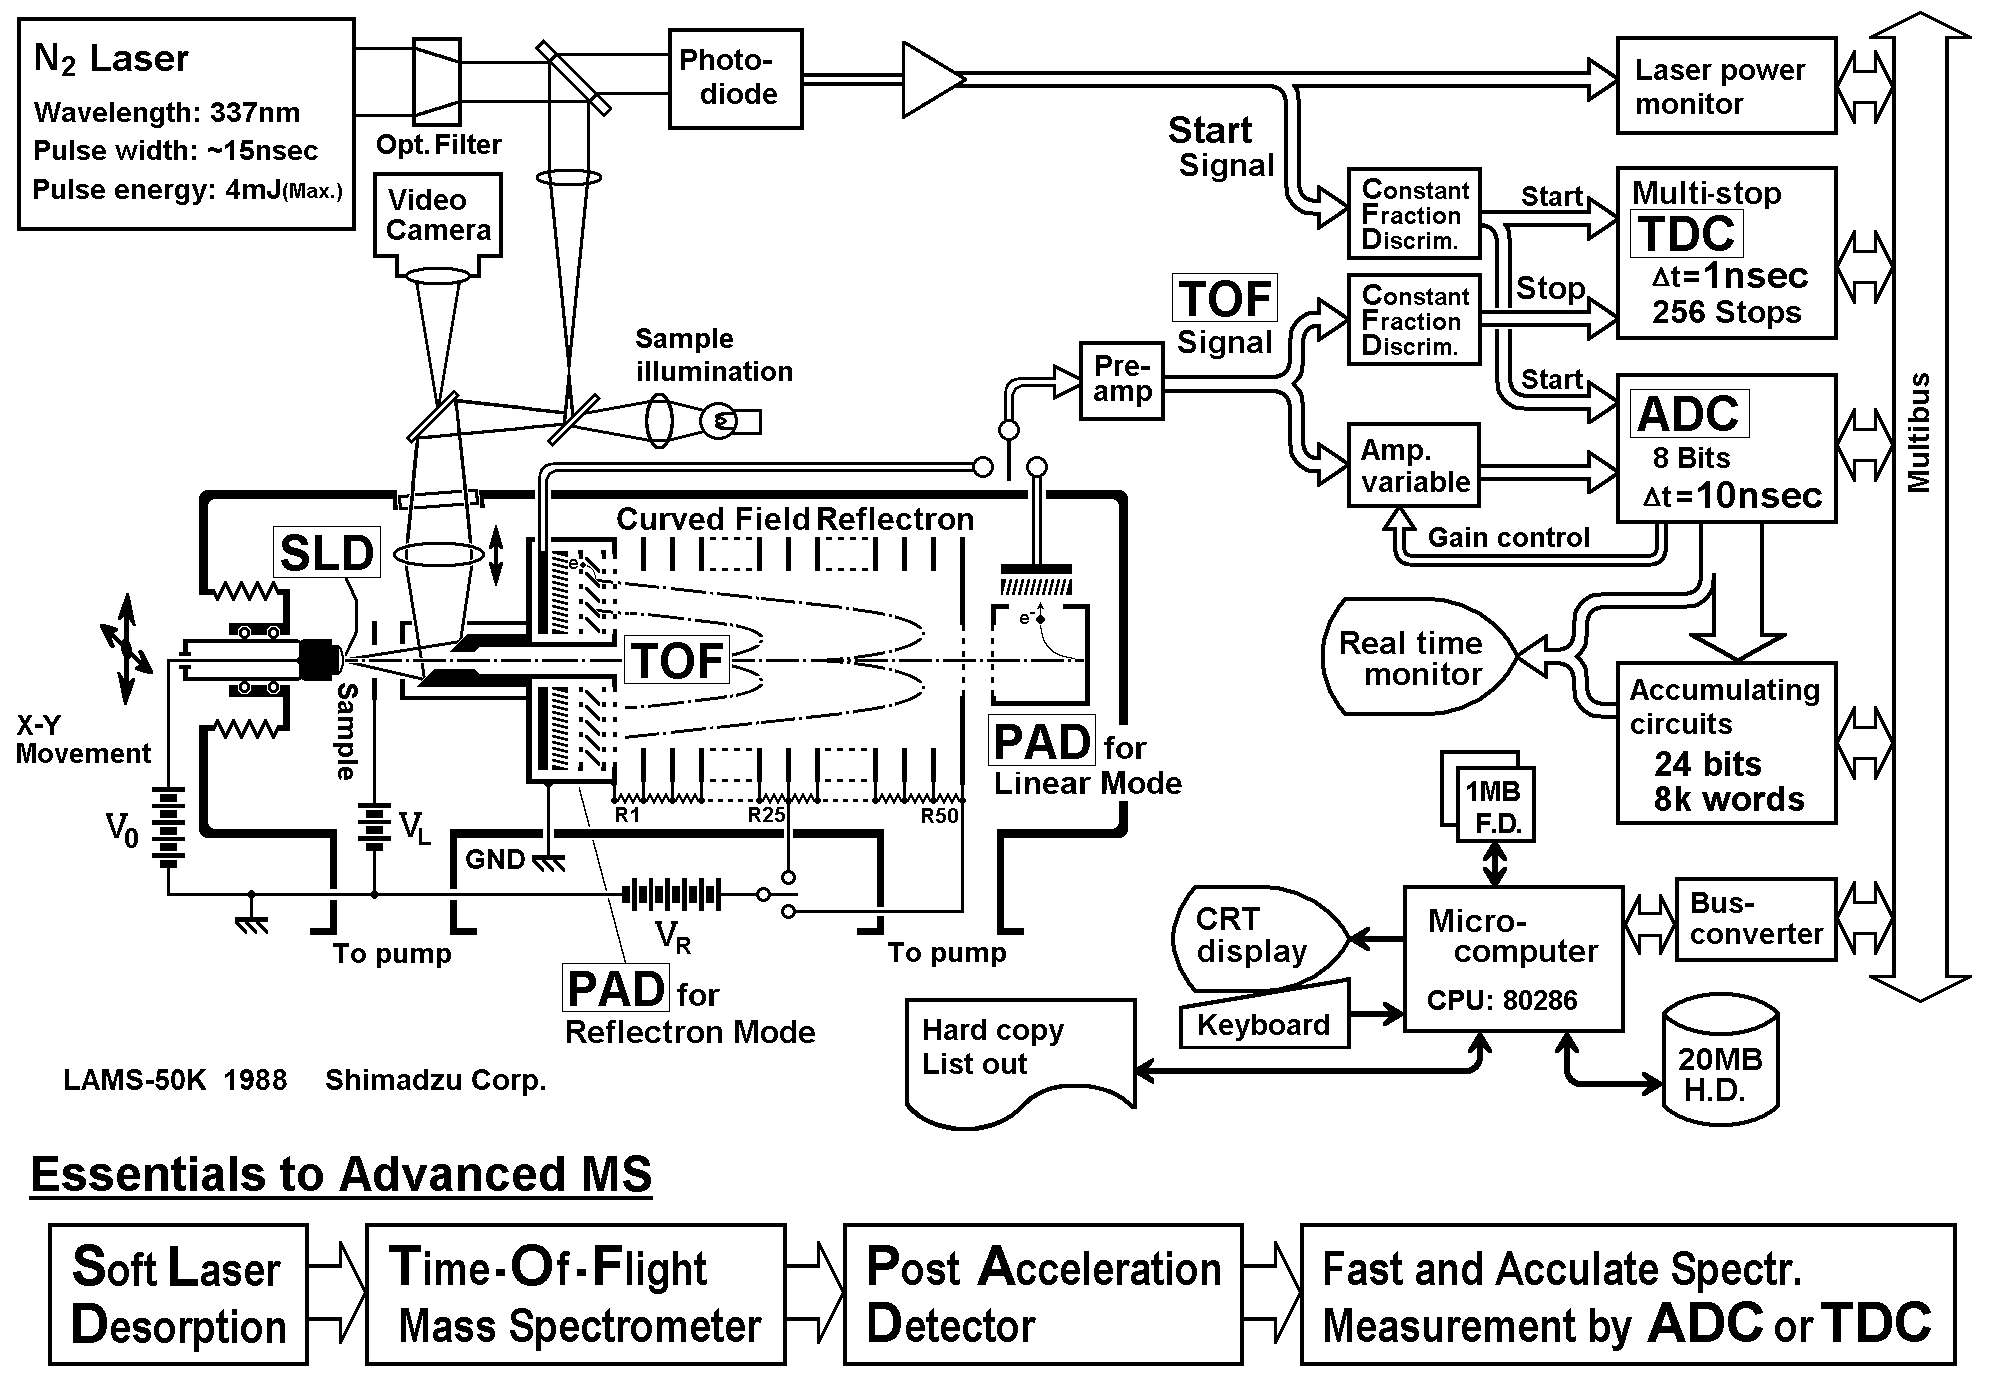
Schematic diagram of LAMS-50K (revised and supplemented from the original 1988 version)
1. What is the Soft Laser Desorption (SLD)?
2. What is the Time Delayed Ion Extraction Method?
3. What is the Curved Field Reflectron TOFMS?
4. What is the Post-Acceleration Detector?
5. What is the Analog-to-Digital Converter (ADC) circuit?
6. What is the Constant Fraction Discriminator (CFD)?
7. What is the Time-to-Digital Converter (TDC) circuit?
8. What is the actual measured protein data?
9. What is the Laser Ionization MS that the Shimadzu Group has commercialized?
It's worth mentioning that Koichi Tanaka is a graduate of the Saburo Adachi Antenna Engineering Laboratory at Tohoku University. This university has made significant contributions to the invention of the Yagi-Uda Antenna (invented in 1924, IEEE Milestone) and the Mushiake Antenna (invented in 1948, IEEE Milestone). https://ethw.org/Milestones:List of Milestones
This tradition is thought to have encouraged Tanaka to venture into new inventions, even in different engineering fields.
1. What is the Soft Laser Desorption (SLD)?
Mass Spectrometry (MS) is, as the name suggests, an analytical method for "measuring the weight of elements and compound molecules". However, unlike methods such as a scale that measures total weight, MS is a method that measures the weight of nano-size components, such as individual element or compound molecule, using electric and magnetic fields to separate them by weight.
Since elements and compound molecules do not react to electric or magnetic fields when they are in a neutral state without a charge, making it impossible to distinguish differences in weight, some means of charge addition are necessary before separating them by weight. One of these is the Soft Laser Desorption (SLD) method.
When pulse laser light is irradiated onto a compound, compounds that can directly absorb the light are more likely to decompose due to an increase in internal energy, whereas if they cannot absorb the light, they remain solid or liquid phase and cannot reach a state where individual molecules can move freely (into gas phase). The method to cause compounds to desorb into the gas phase without decomposing them is the "Soft Laser Desorption" method, which won the Nobel Prize in Chemistry in 2002. In this case, it is necessary to mix a medium, called a matrix, that can absorb laser light and ionize the compound to be measured as much as possible without decomposing it. In the initial invention in the 1980s, a mixture of Ultra Fine Metal Powder (UFMP), which efficiently absorbs laser light, and liquid glycerin was used to softly desorb into the gas phase. In recent years, the "Matrix-Assisted Laser Desorption Ionization" (MALDI*) method has become the mainstream.
The development of this method has made it possible to ionize even large molecules like proteins, which were previously thought to be impossible to desorb and ionize without decomposing them.
The UFMP was a very fine nano-sized powder that could only be produced in Japan at the time, so it was called "Japanese Powder" (manufactured, for example, by Vacuum Metallurgical Co., Ltd.). This is thought to be one of the reasons why the SLD was invented in Japan for the first time in the world.
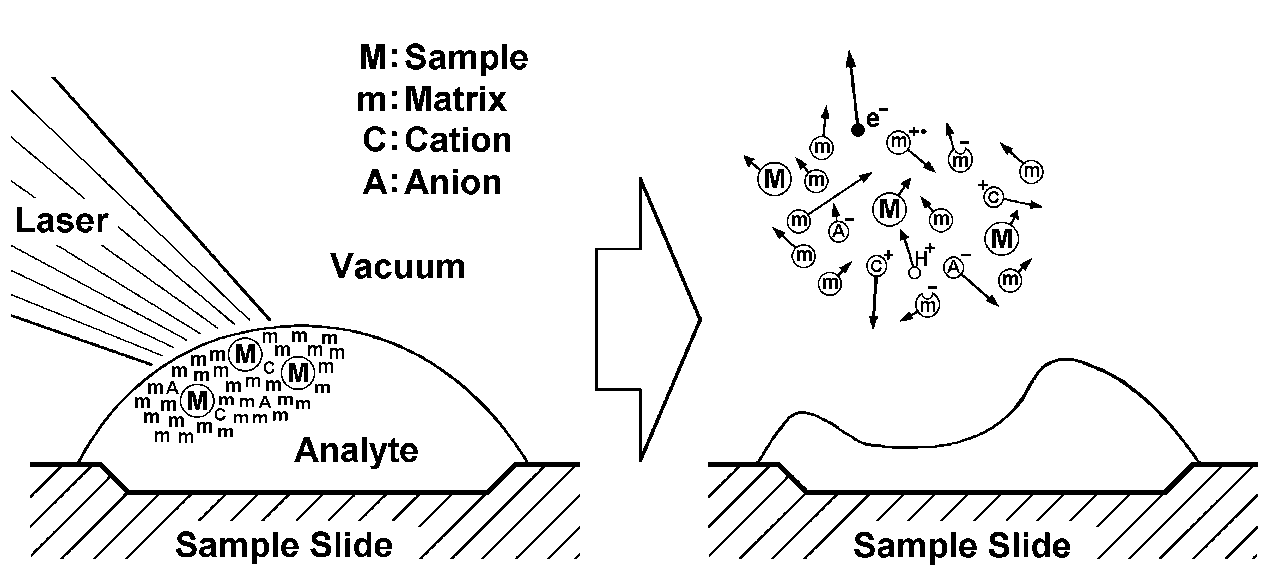
Simplified explanation diagram of Soft Laser Desorption method
* The relationship between MALDI and SLD
MALDI was invented in 1985 by German scientists Dr. Hillenkamp and Dr. Karas. As the name “matrix-assisted” suggests, it is a method that ionizes by the assistance of added (organic) compounds. Initially, it was confirmed to have a promoting effect on ionization of low-to-medium molecular weight molecules such as peptides. On the other hand, SLD can be considered as a general term for the concept and method of "gentle desorption (ionization) using laser light". In other words, it can be interpreted to encompass MALDI, SELDI, DIOS, etc.
Refer to the 2002 Nobel Prize in Chemistry Nobel Foundation site
(https://www.nobelprize.org/prizes/chemistry/2002/summary/ )
2. What is the Time Delayed Ion Extraction Method?
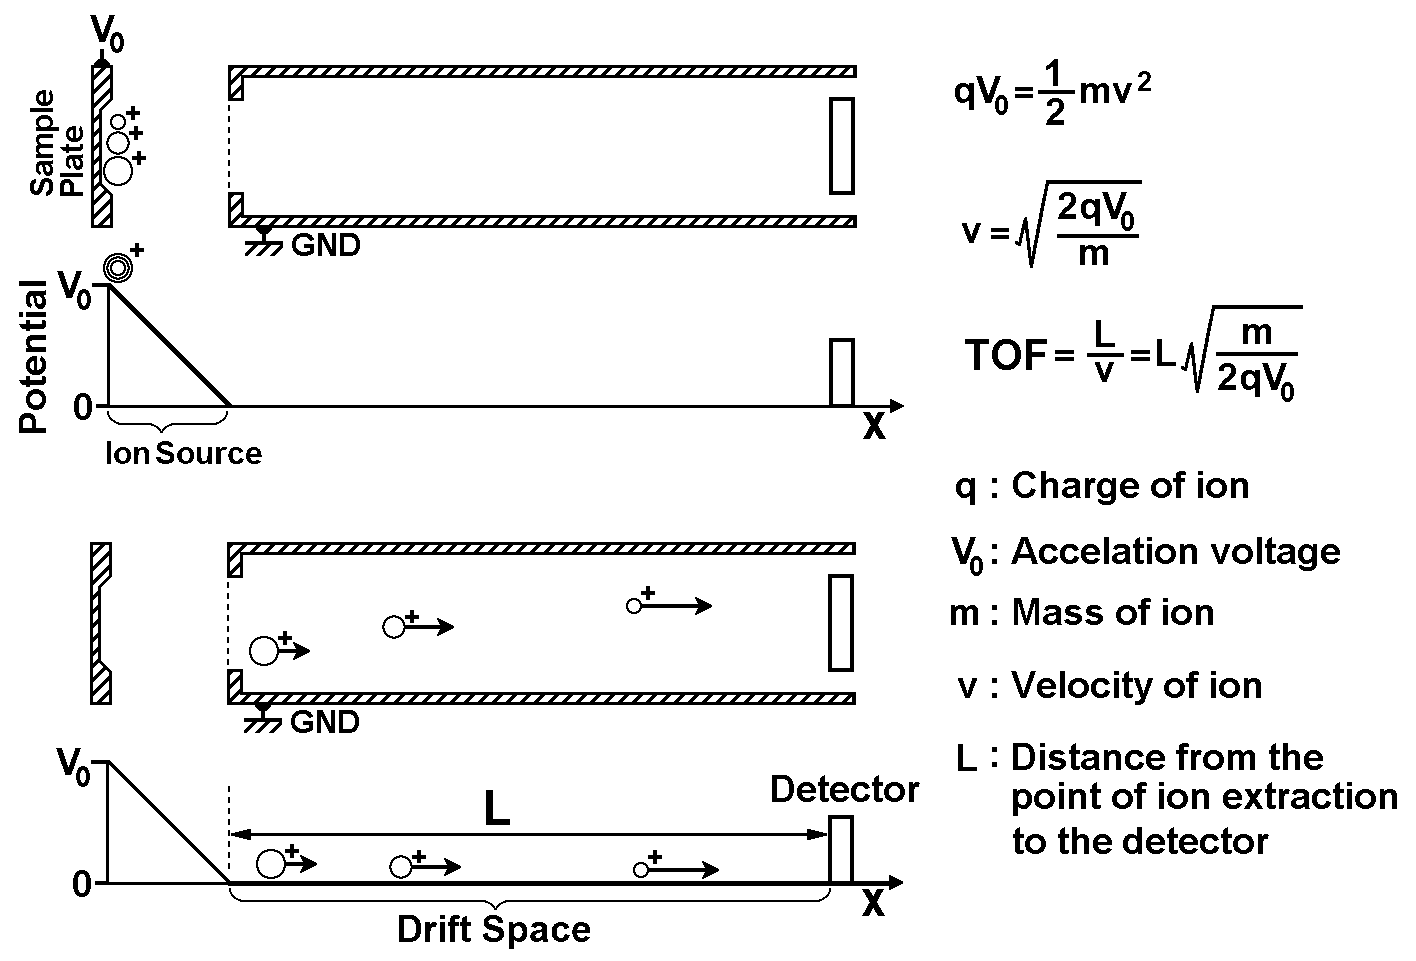
The simplest formula that represents the principle of Time-of-Flight Mass Spectrometry (TOFMS) can be derived from the Law of Conservation of Energy that expresses "the electrical potential energy at the time of ion generation is equal to the kinetic energy after acceleration is completed." By transforming this formula, we can derive the TOF for ions with speed v after acceleration to fly at a constant speed through space L (ignoring the flight time during acceleration).
The ions generated after laser irradiation have an initial velocity, whether large or small. In other words, ions can be accelerated other than potential energy (V0→V0+ε), and as a result, there may be a distribution in the time for ions of the same m/z* to reach the detector, so there may be cases where isotopes of lead 206,207,208, as shown in the upper right of the figure below, cannot be separated.
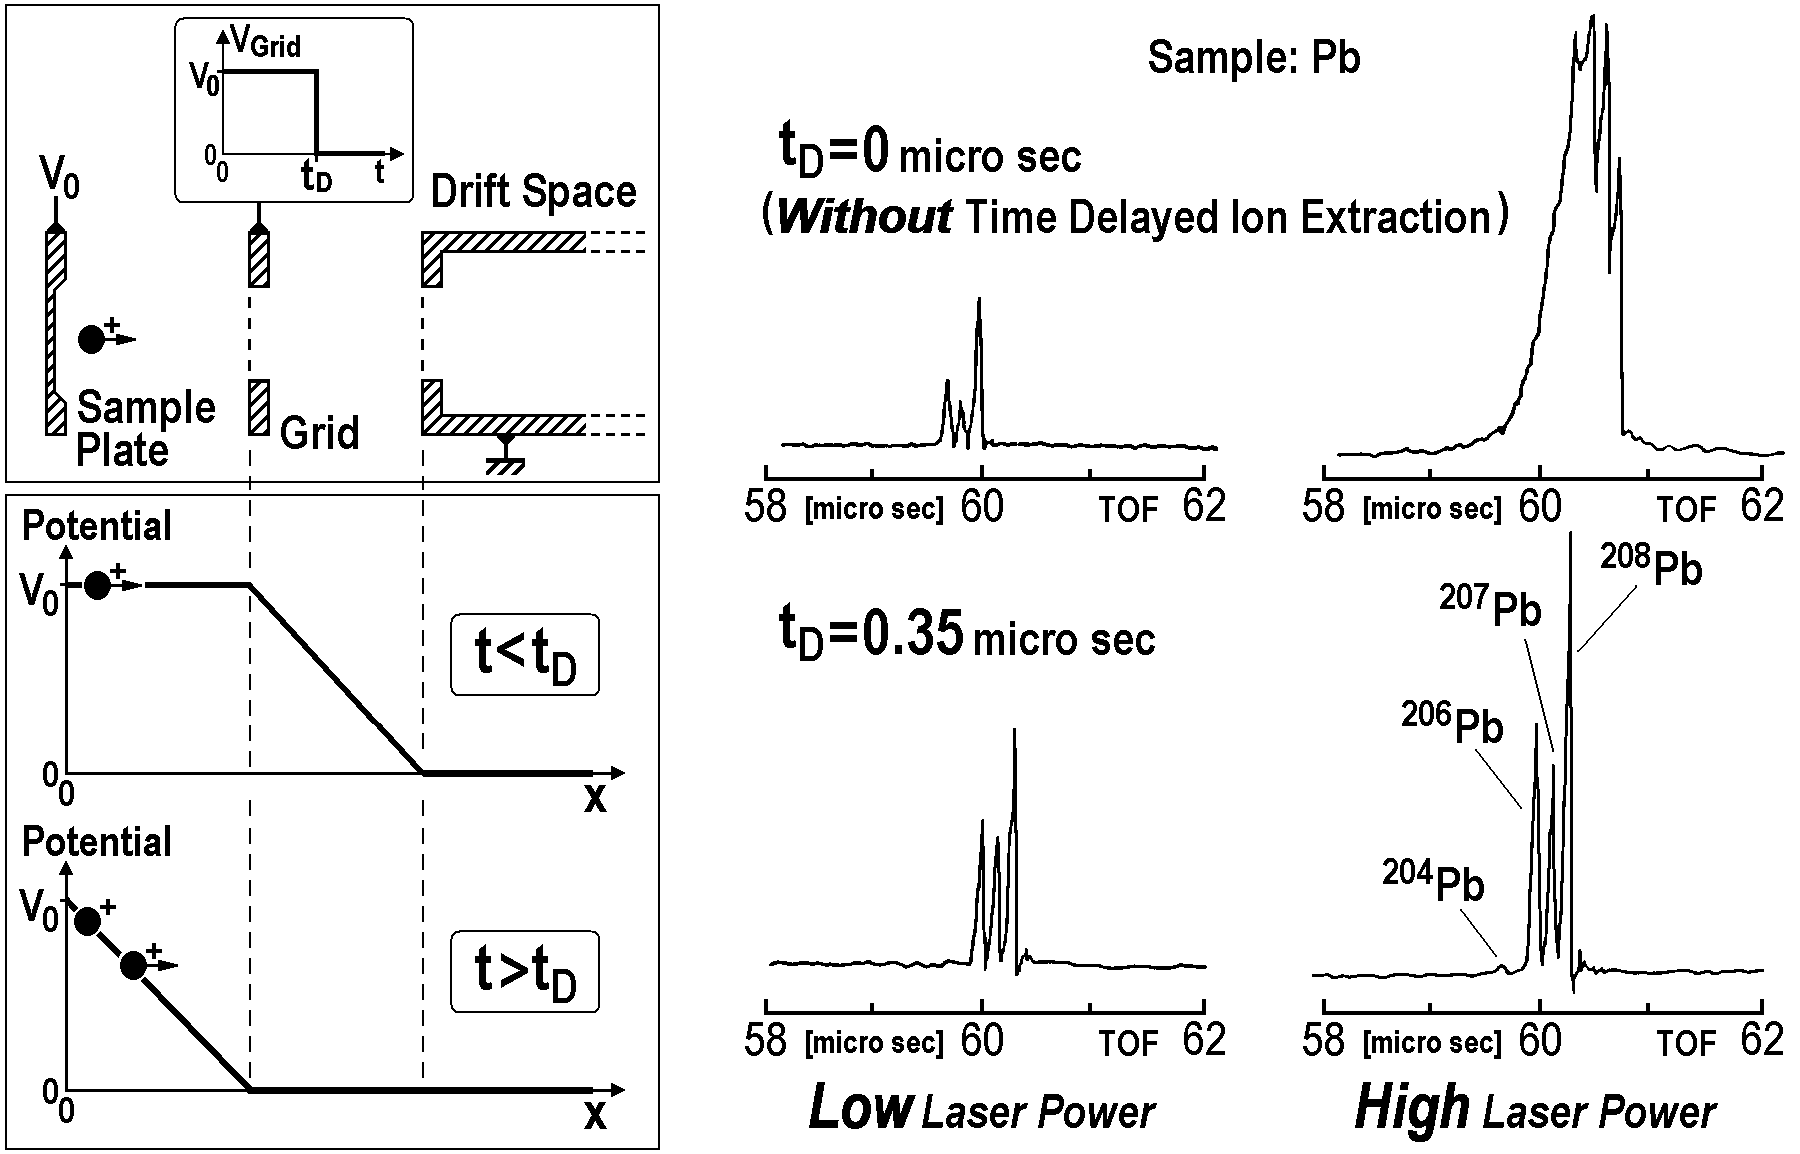
On the other hand, if the extraction voltage V0 is applied after a little time tD from ion generation, as shown in the lower left of the figure above, ions that have already started flying with an initial velocity are accelerated with less positional energy than V0. If a tD can be set such that the reduced acceleration exactly compensates the initial velocity, the same m/z ions can reach the detector at the same time, resulting in an improved mass resolution. This method is generally called “Time Delayed Ion Extraction”.
This technology developed at Central Research Laboratory in Shimadzu Corporation was applied for a patent in 1985**, but was not adopted for the LAMS-50K. However, since the 1990s, various methods have been developed, particularly in Europe and the United States, to further improve resolution and accuracy, and now methods with M/⊿m: several thousand to tens of thousands have become mainstream.
* Mass-to-charge ratio: One unit of mass is 1/12 of carbon 12, and one unit of charge is the charge of one electron.
** the Japan Patent Office [S60035097] in 1985
3. What is the Curved Field Reflectron TOFMS?
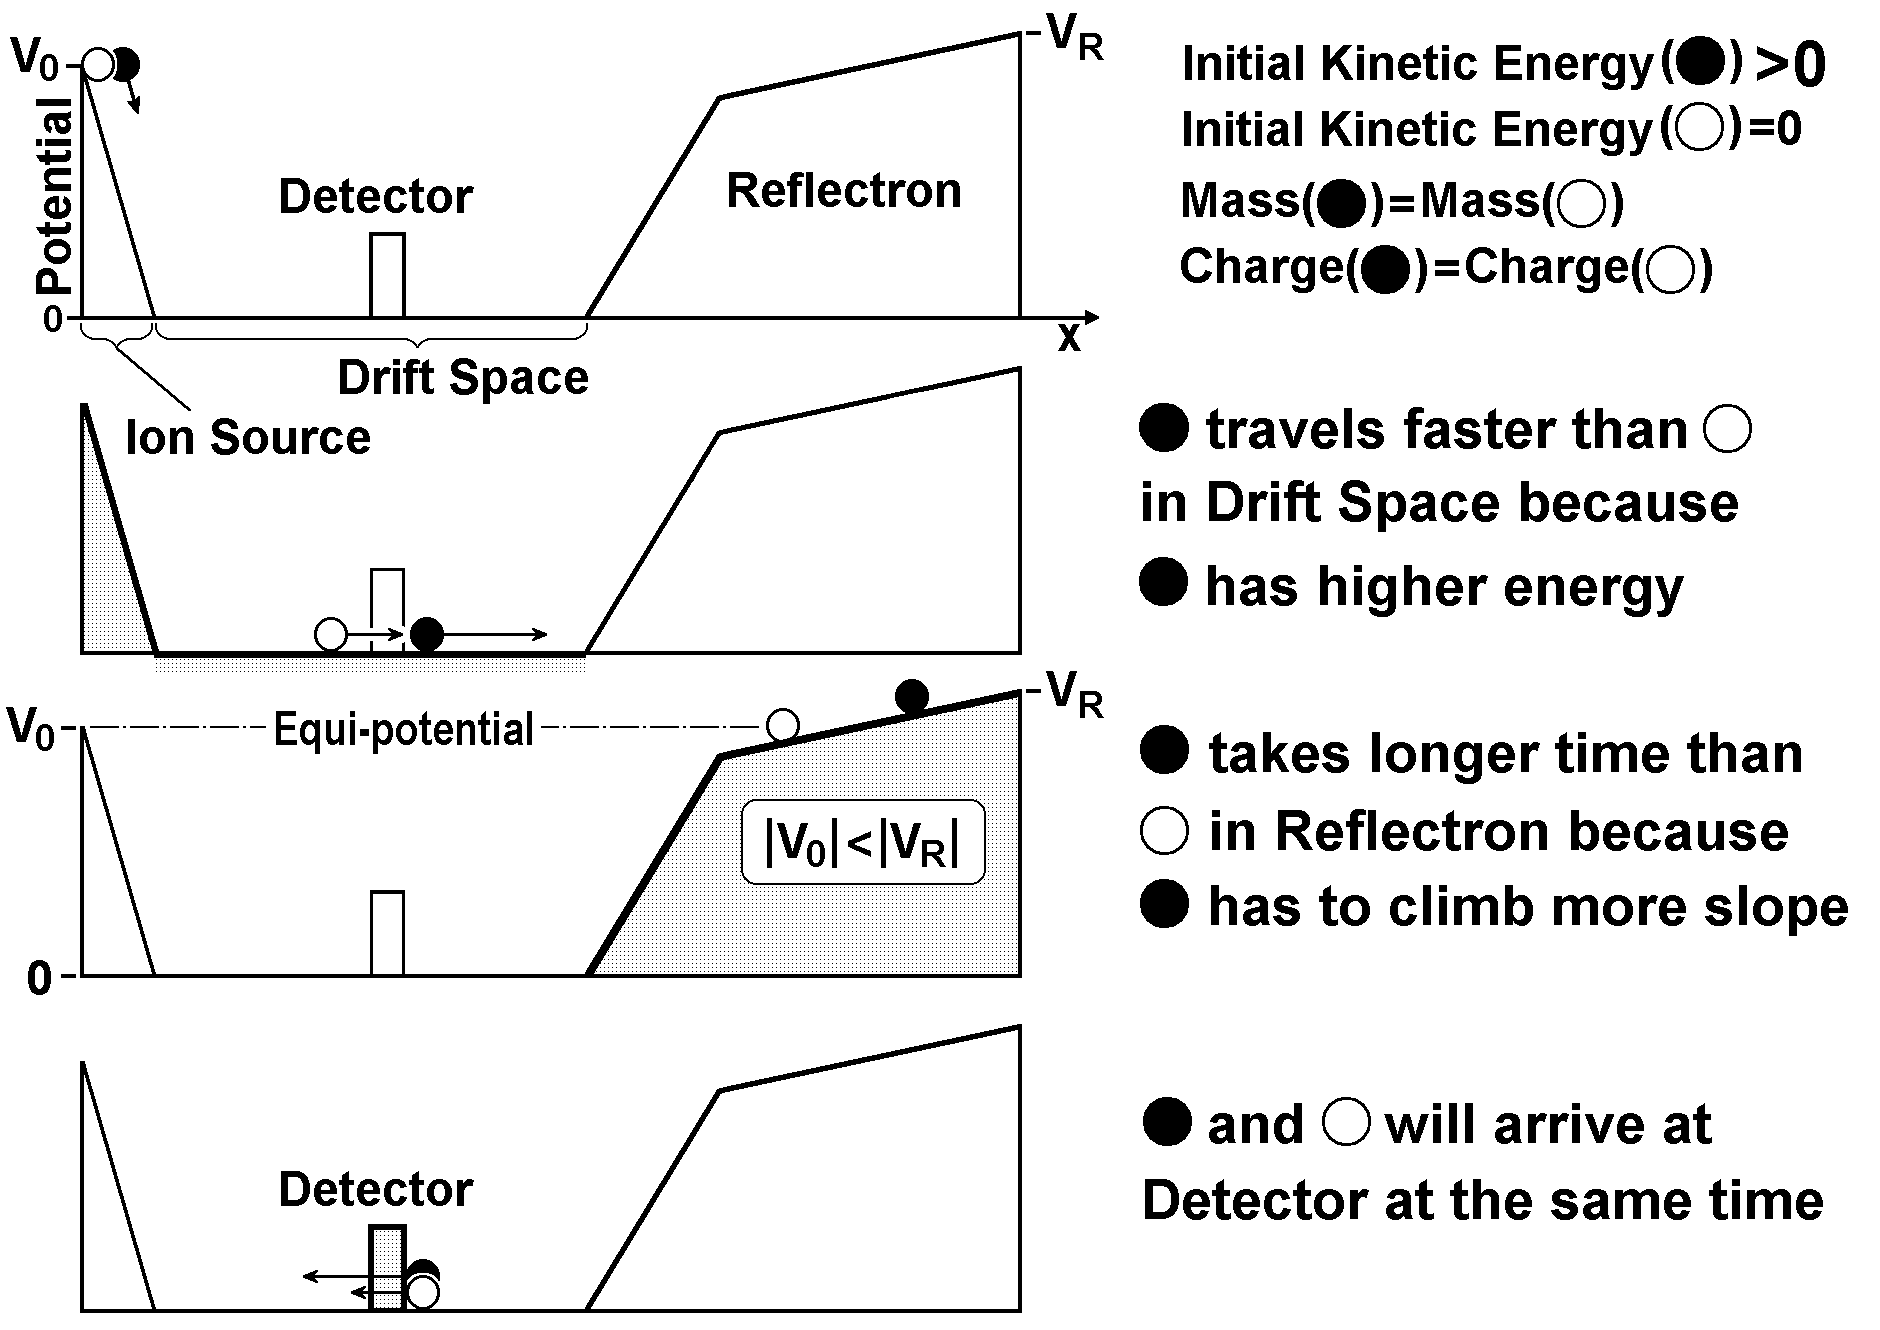
The “Time Delayed Ion Extraction” is a method to increase mass resolution by adjusting the timing of ion extraction to make the flight time for ions with the same m/z to reach the detector the same. On the other hand, a method to make the cycle time of ions with the same m/z the same even with a distribution of initial energies ε is an application of the "Isochronism of the Pendulum." In this case, a restoring force proportional to the distance away from the center of amplitude is needed. If applied to TOF, even if the energies possessed by ions are different, if the m/z is the same, they will reach the detector at the same period of TOF.
Recently, in TOFMS, reflectrons utilizing the above physical phenomenon "Isochronism of the Pendulum" are often used. The distribution of initial energy is up to about 100eV, and in TOF, an acceleration voltage of around 20kV is applied, so the range where energy convergence is necessary is "only in the vicinity where ions are reflected", and "only in that vicinity fine isochronism needs to be achieved". In other words, as shown in the figure below, reflectron which has a structure combining steep and gentle slopes was initially (20th century) extensively researched and developed, and adopted into products.
At Central Research Laboratory in Shimadzu Corporation, we developed a “Curved Field Reflectron” and adopted it in the LAMS-50K. This mechanism also maintains the "Isochronism of the Pendulum" to some extent for (Post Source Decayed )ions that have lost a significant amount of energy by decomposing before going into the reflectron. Therefore, for example, even if the voltage VR for full-length reflectron(50cm) is applied to a part that is a half of the reflectron(25cm), some degree of energy convergence can be achieved.
Refer to "8. What is the actual measured protein data?"
Refer to U.S. Patent US4625112
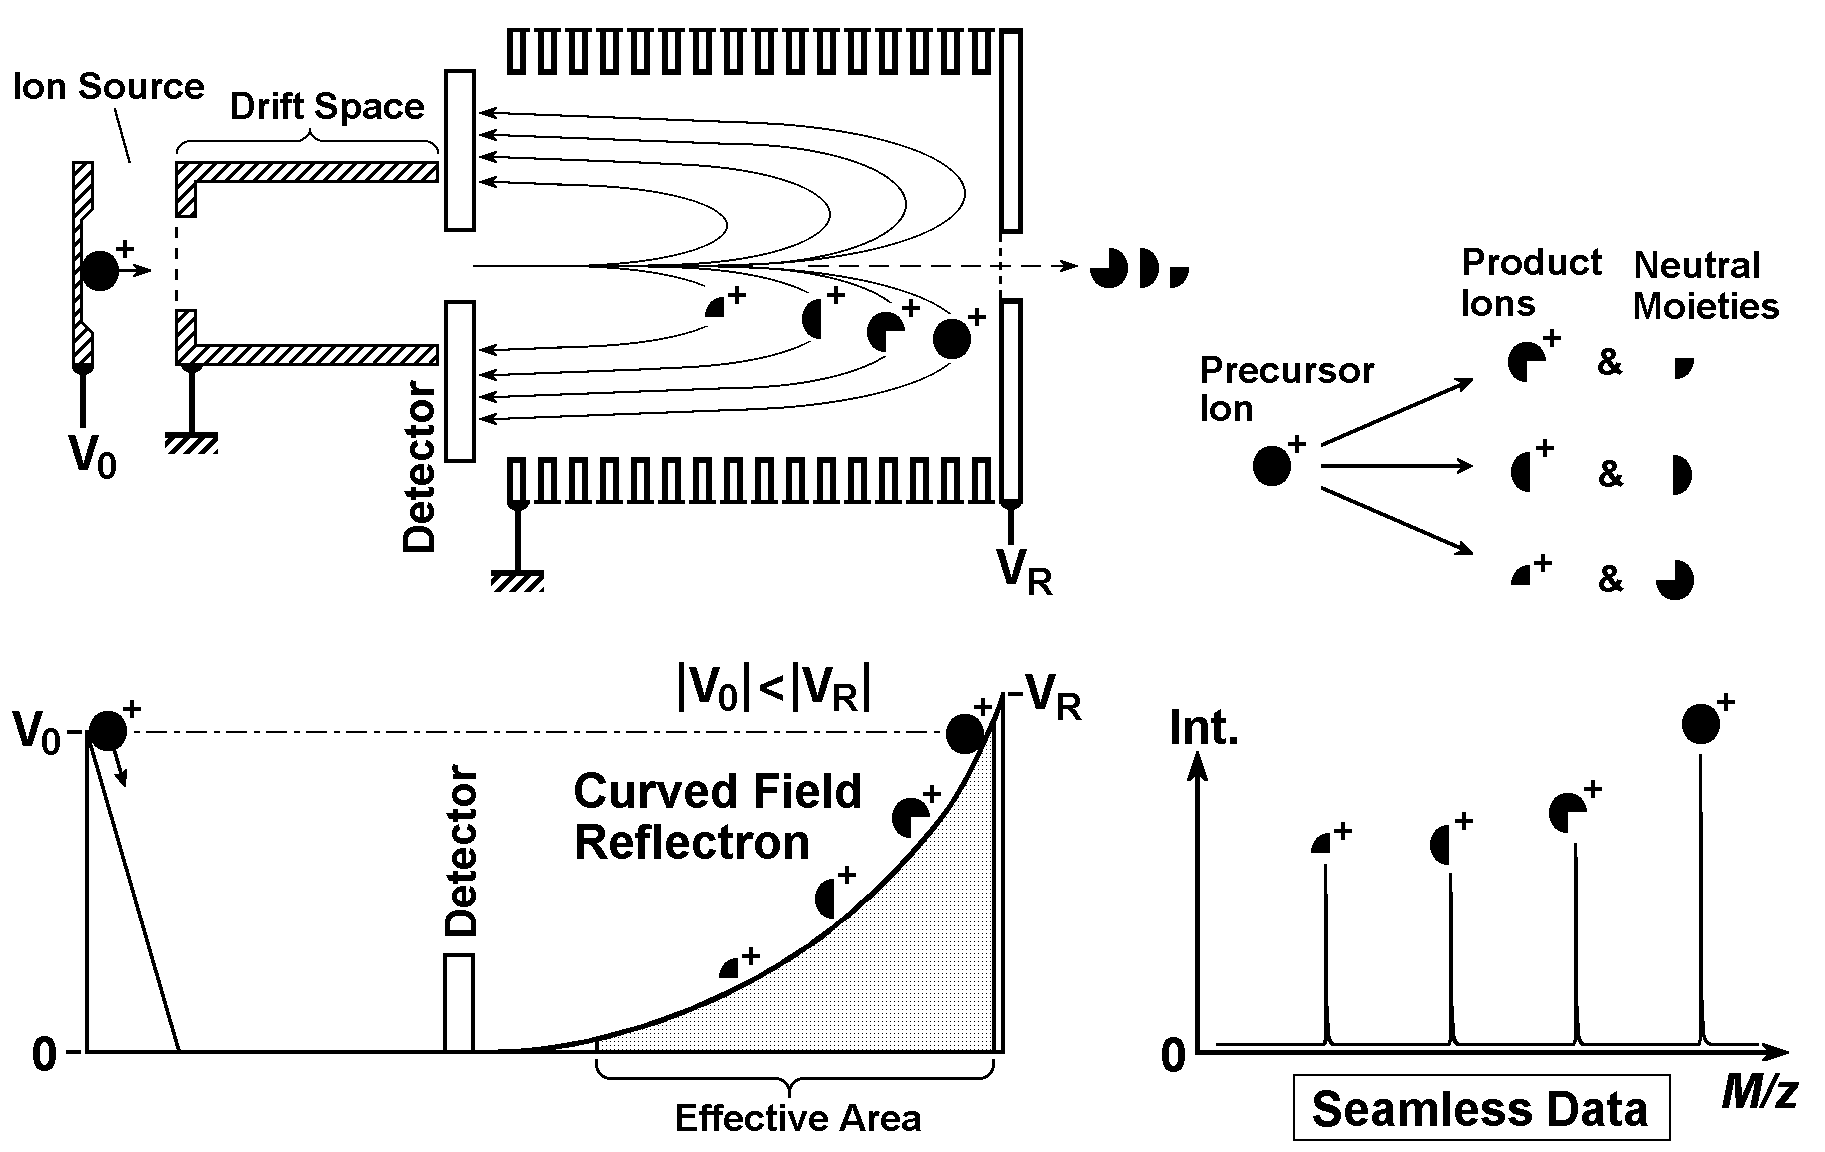
Schematic diagram of Curved Field Reflectron adopted in LAMS-50K and voltage application diagram
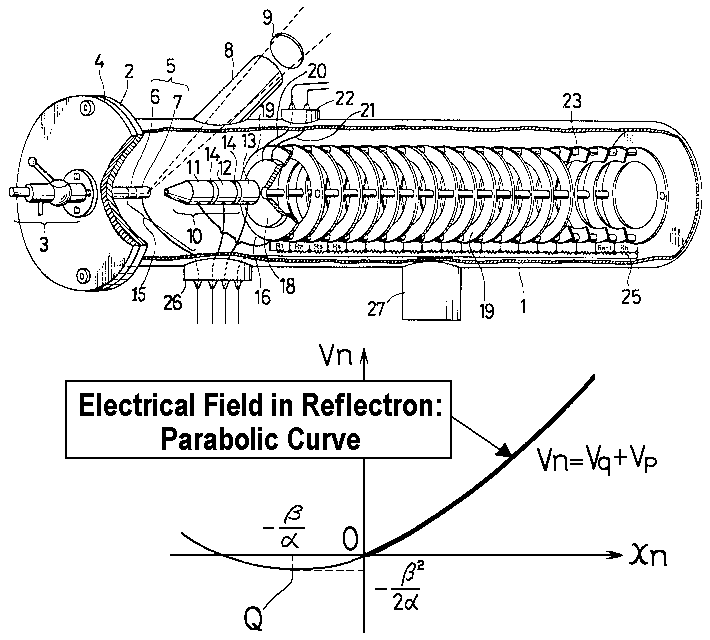
Excerpt from US Patent 4625112
4. What is the Post-Acceleration Detector?
In many of today's mass spectrometers, ion detectors are used as devices to convert ions (charged particles) to electrical current or voltage for electrical circuits. The first electron generated in the detector is then accelerated to collide with the surface inside the detector to double, quadruple, octuple... the number.
Especially in the TOFMS, the speed of high mass (high m/z) ions decreases (refer to ion speed v in "2. What is the Time Delayed Ion Extraction method"), and even if ions collide with the detector surface, it becomes difficult or impossible to knock out the first electron. Therefore, in the 1980s, it was considered impossible to detect ions with m/z over 10,000, such as proteins, with an acceleration of about 5kV.
In LAMS-50K, both the Linear TOF, which simply allows ions to fly straight, and the Reflectron TOF, which turns ions around with a reflectron ("3. What is the Curved Field Reflectron TOFMS"), adopted a post acceleration method that re-accelerates ions after ion separation and incorporates a Conversion Dynode to perform ion-electron conversion on a special metal surface. Furthermore, a Micro Channel Plate(MCP) from Hamamatsu Photonics was used as the final electron multiplier. The detector for the TOFMS needed to make ions with the same m/z arrive and amplify at the same time, so it can be said that the adoption of MCP with a flat and wide plane was one of the necessary conditions.
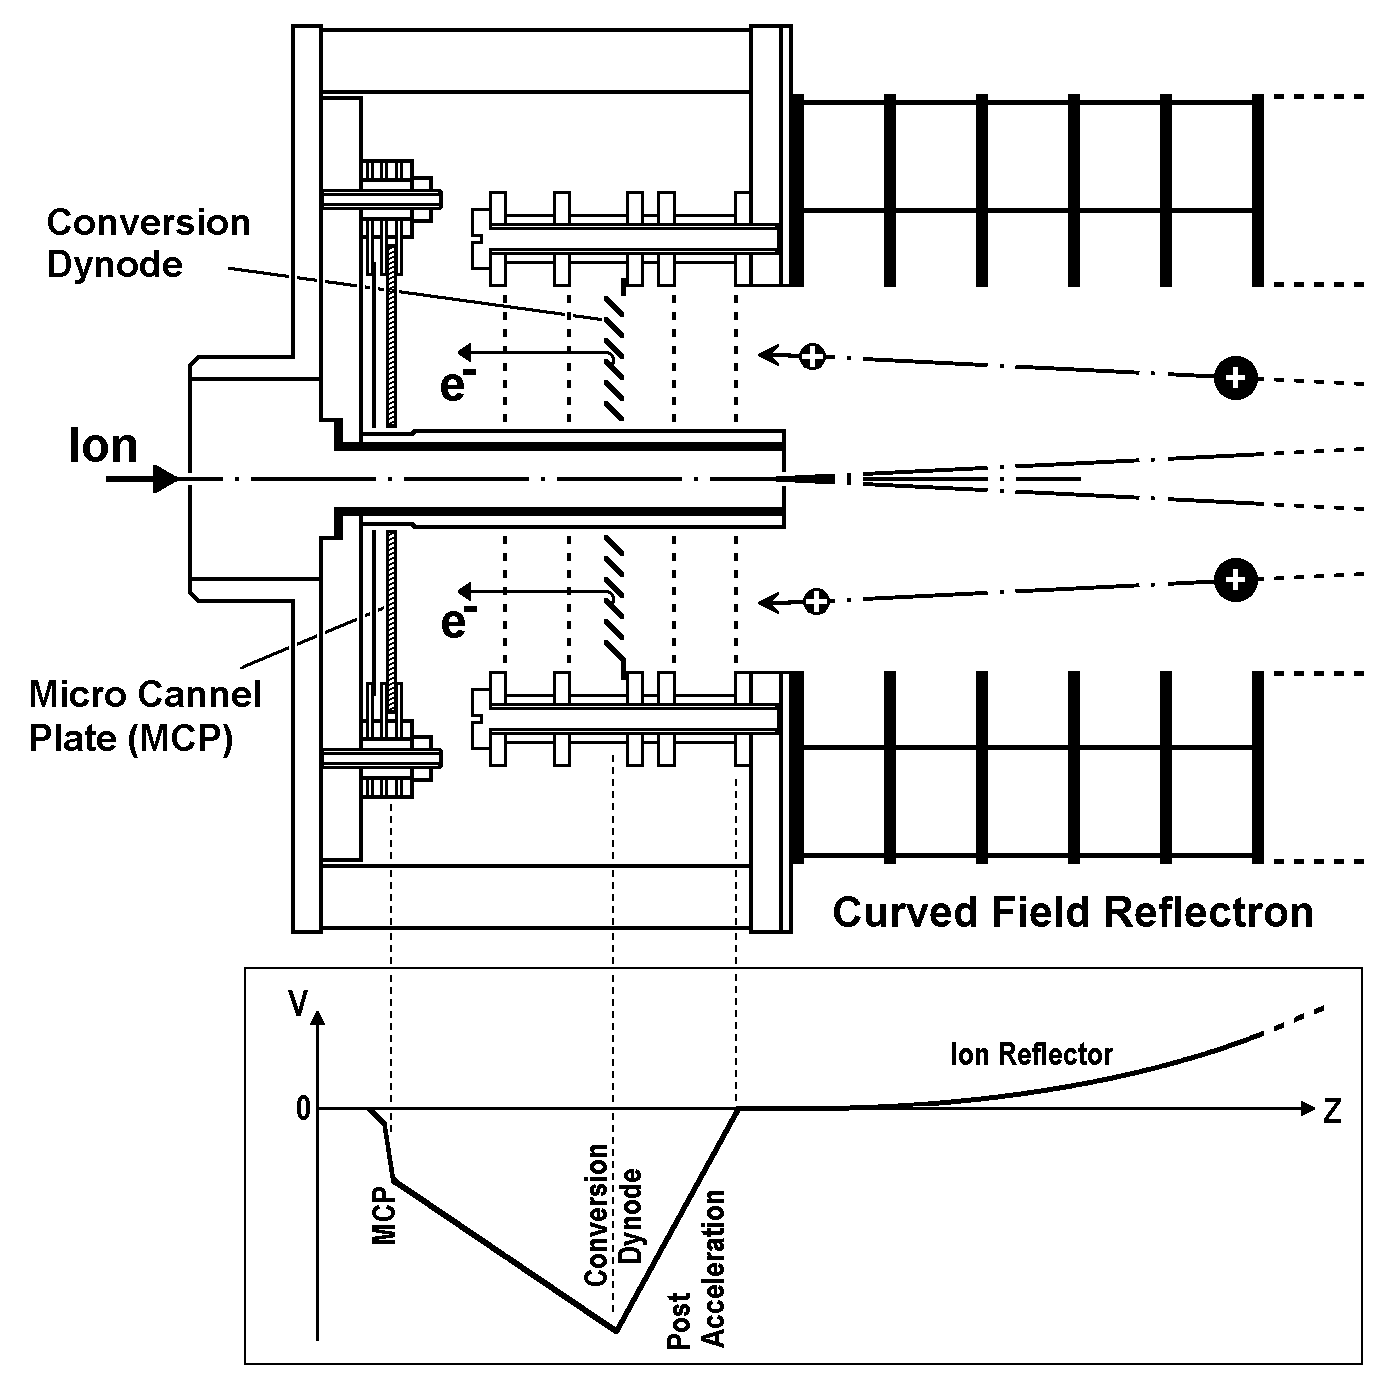
Cross-sectional diagram of the Post-Acceleration Detector for the Reflectron used in LAMS-50K
(revised from the original 1988 version)
5. What is the Analog-to-Digital Converter (ADC) circuit?
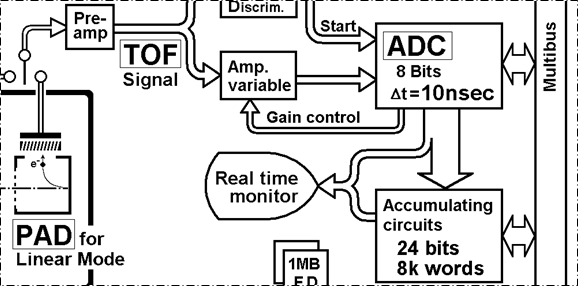
The analog signal data output from the detector of the TOFMS changes the vertical axis: ion intensity every 1nsec to several tens of nsec on the horizontal axis. The circuit that converts this analog signal into a digital signal is called Analog-to-Digital Converter (ADC). In the 1980s, the Sony CX-20116 was the ADC with the highest time resolution (10nsec) and a certain level of intensity resolution (8bit: 0-255) (see the silver board in the upper left of the photo below).
The signal S for each laser shot has more or less variation and a lot of noise N, and especially the signal derived from proteins is weak, so it is difficult to measure data with sufficient S/N and reproducibility with one shot measurement. In LAMS-50K, we, at that time of team, designed and manufactured a 24 bits, 8k words accumulation circuit that effectively utilizes buffers to sequentially accumulate a large amount of data that changes at high speed in TOFMS spectra.
Note that there are many white coaxial cables wired on the board on the left side of the photo. This is a trick to synchronize each signal so that there is no time lag. Also, there are several thin green wires (jumper wires) on the board on the right side, but these boards are for prototype devices and have been resolved in the product version.
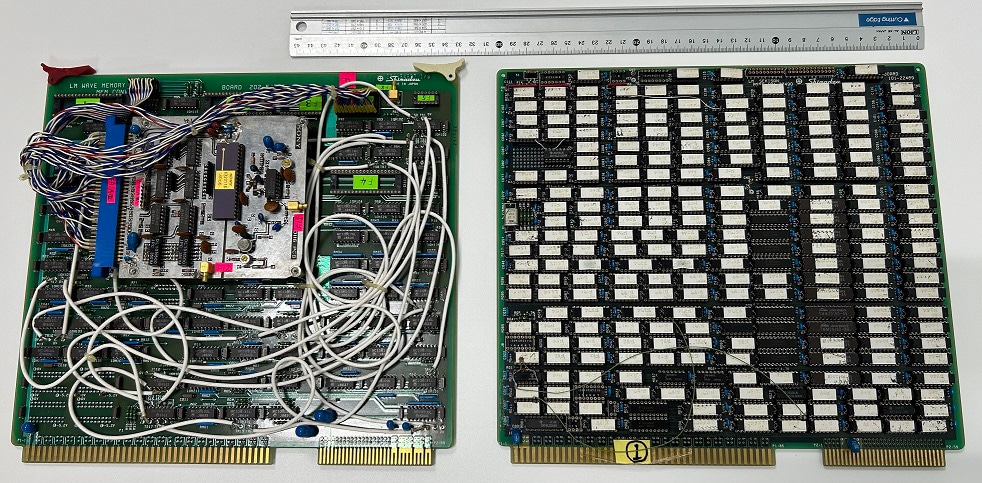
ADC Circuit and 24 bits, 8k words Accumulation Circuit (Prototype)
In the spectrum of the TOFMS, peaks with weak and strong intensities are mixed, and the best intensity resolution of 8 bits at the time could not ensure quantitativeness and dynamic range.
In LAMS-50K, up to eight Time Windows could be set, and a Gain Control circuit that independently provided up to eight times the amplification rate was installed before the ADC, as shown in the figure below, so that more appropriate S/N data could be obtained in the flight time range of each window. The maximum measurement point at that time was 8k words (8,192 points), and it can be said that it was necessary to devise a way to measure only the necessary parts with an appropriate gain in a wide flight time from low m/z to high m/z for measuring proteins and the like.
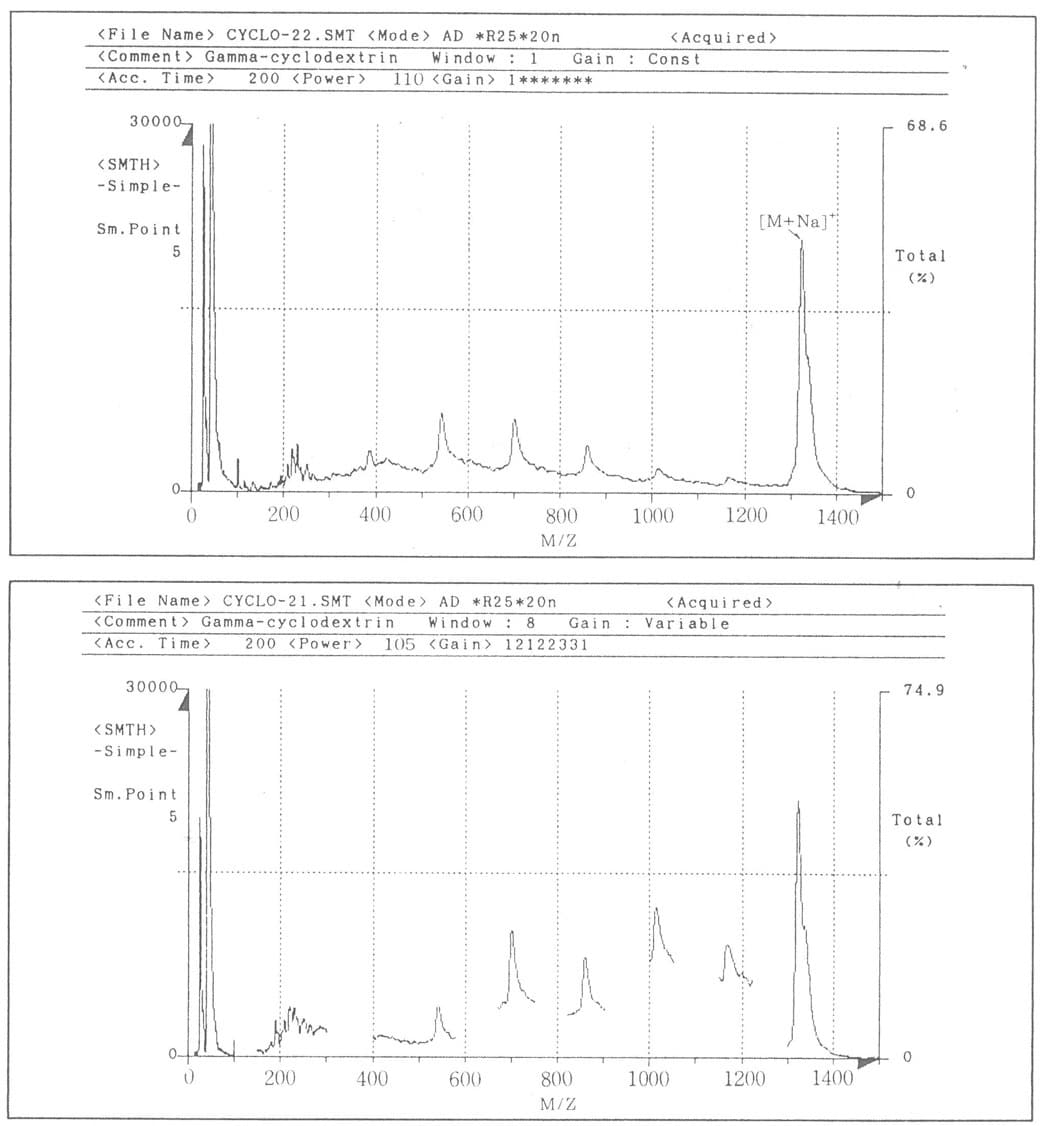
Examples of MS data with one Time Window (upper figure), and eight Time Windows (lower figure) with independent gains
From the LAMS-50K brochure
6. What is the Constant Fraction Discriminator (CFD)?
Typically, in MS, not limited to the TOFMS, peaks of various intensities are detected in the spectrum. There are often cases where the gravity center of each peak is determined as the detection point (horizontal axis position), but if ions arrive discretely enough, there is a method of determining the rise of the peak.
When is the peak rising? There are cases when the intensity exceeds a fixed value, namely fixed threshold, and cases when it exceeds a certain proportion, Constant Fraction, to the peak vertex.
In the fixed case, as shown in the top figure below, the detection time varies depending on the strength of the peak, but in the case of a constant ratio (bottom figure), there is no change. It can be said that the adoption of the Constant Fraction Discriminator (CFD) is suitable for accurately determining the time of the peak position in real time in TOFMS. Here, zero cross timing is set as the peak detection time.
In LAMS-50K, it is used in the stage before the Start signal of TDC (refer to “7. What is the Time-to-Digital Converter (TDC) circuit?”) and the ADC accumulation circuit. Because an optical filter is inserted to adjust the amount of laser light irradiated to the sample, the peak value of the photo diode output changes, but it is designed to be able to input the start signal to the ADC and TDC circuits without being affected by the peak intensity by the CFD circuit.
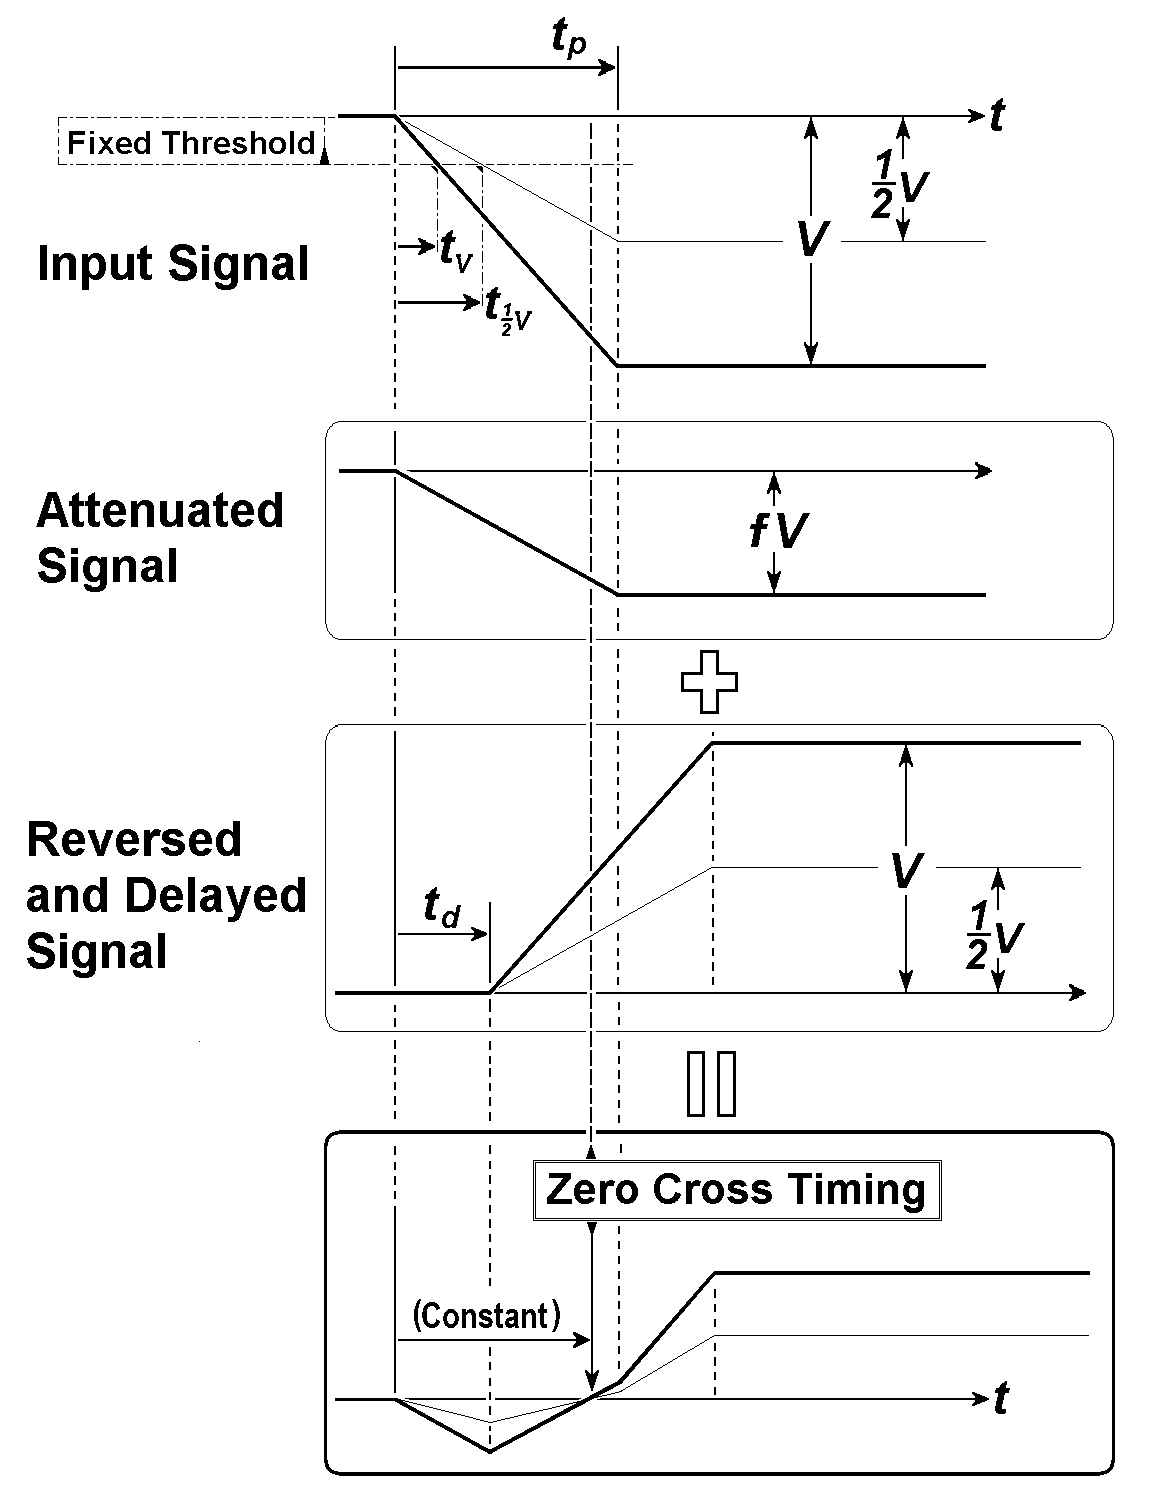
Diagram explaining the principle of the Constant Fraction Discriminator (revised and supplemented from the original 1988 version)
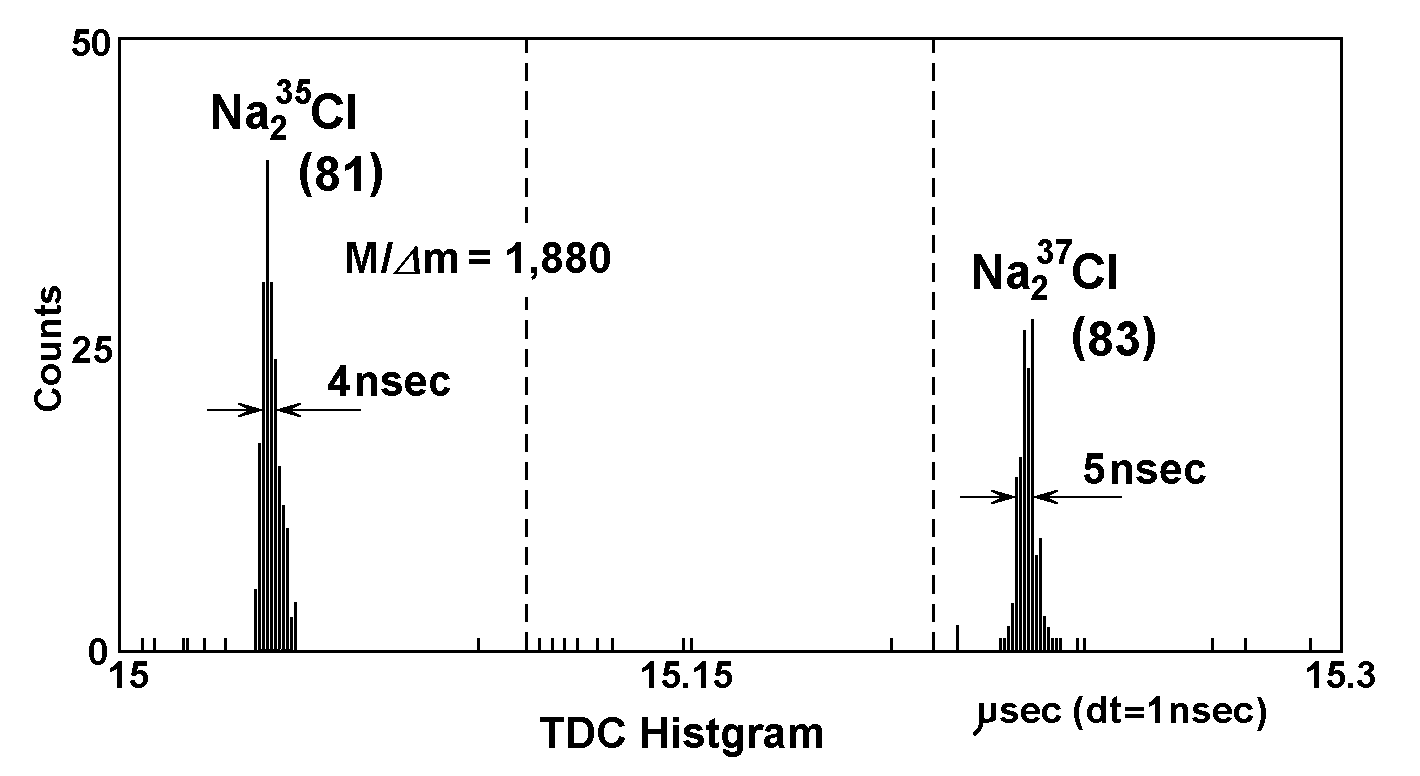
7. What is the Time-to-Digital Converter (TDC) circuit?
Unlike the ADC, the TDC creates a histogram, i.e., one count per ion peak, so the intensity information of every one spectrum is lost. Therefore, it is not suitable for checking isotope distribution or quantitative measurement, but the count number in the time bin with high peak occurrence increases, you can roughly know the amount of existence by accumulating a certain number of times.
In LAMS-50K, since there is a CFD not only in the start signal based on the laser emission but also in the stage before the stop signal from TOF ion detection, it is possible to measure the peak position: rising time of both start and stop with higher time accuracy than ADC, so it has become a TOF-MS data with high time resolution for that time in 1980’s, as shown in the figure below.
In TOF Mass Spectrum, there are often many ion peaks detected with one laser shot, and in LAMS-50K, it was possible to measure up to 256 stop signals for one start.
The figure below shows an example of a TDC circuit board used in the experimental device. We used Hitachi's ECL (Emitter Coupled Logic), which was the fastest processing at that time.
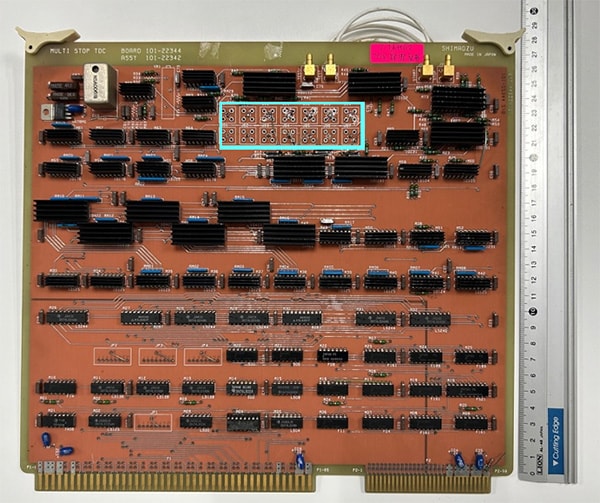
TDC Circuit (Prototype)
The distance that an electron travels in a circuit board and wiring in 1 nsec is about 30 cm. In LAMS-50K, in order to generate a 1 nsec time bin using eight delay lines, seven coaxial cables of different lengths each about 30 cm, namely 0cm (no coaxial cable for delay line), 30cm, 60cm, 90cm,…, 180cm and 210cm, were soldered to the back of the board (light blue box in the photo). A part of it can be seen on the upper right side of the photo.
Currently, ADCs with higher time resolution than 1nsec (1GHz or more) are commercially available, and there are fewer devices using CFD and TDC in mass analysis. However, for example, in medical imaging diagnostic devices such as Positron Emission Tomography (PET), they are widely used as detectors for TOF-PET to accurately estimate the position of γ-ray generation that flies at the speed of light (300,000 km/s), i.e., to improve three-dimensional resolution.
Furthermore, in recent years, it has been adopted in some LIDAR, drones, and mobile phones as a TOF measuring device for measuring the distance to obstacles.
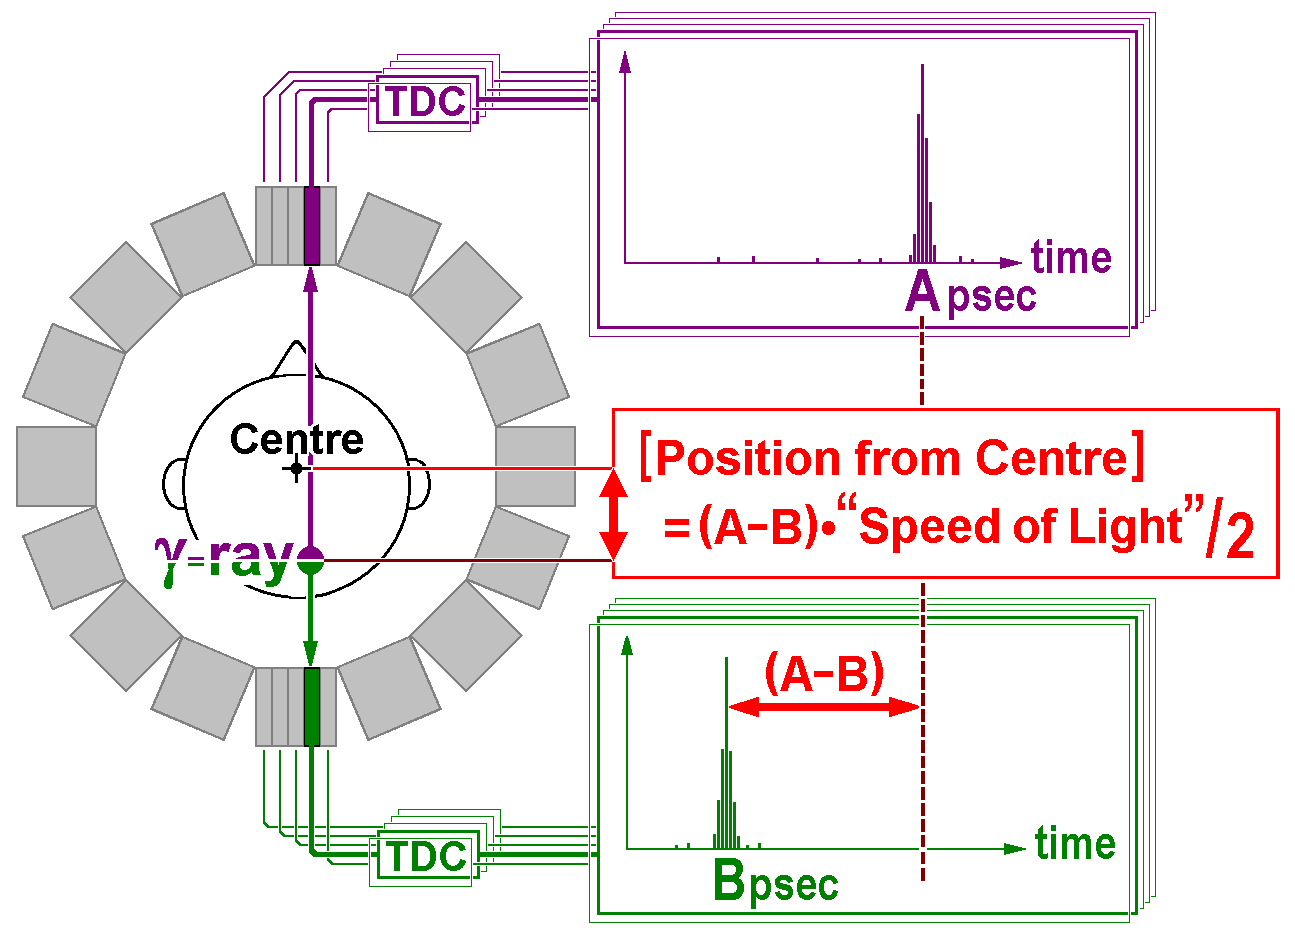
Schematic diagram of TOF-PET using TDC
8. What is the actual measured protein data?
The figure below is a hard copy of a PC screen of an example of successful measurement of ions exceeding m/z 100,000 in 1988, when we were developing the LAMS-50K product. This data is also published in the Nobel Lecture. From the first line shows modes : R25 (Reflectron 25cm), ADC 20n (sec time resolution), and measurement date and time : February 23, 1988, 9:17. The second line shows the mass range m/z: 25,000~105,000. The third line shows the number of accumulation : 500 times, gain : 4 (8 times magnification), and only one of the eight time windows is used. Left side of the spectrum shows smoothing method : simple average, and data points : 15.
Because there are only 8k words, 20 nano sec time bin (resolution) was used. Coverage of mass range was from Lysozyme (M.W.: 14.3k) Cluster Ion 2M (28.6k Da) to 7M instead of including molecular ion M.
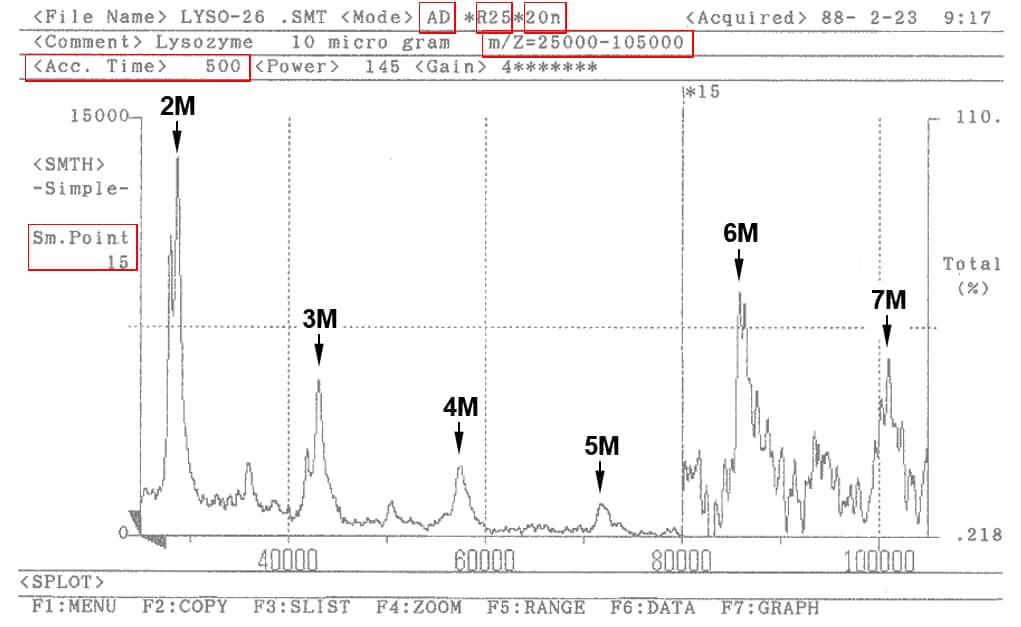
MS Datum of Lysozyme Cluster Ions
The SLD method, which ionizes giant/macro molecules like proteins without destroying them, won the 2002 Nobel Prize in Chemistry. However, in order to actually “see” ions, after ion creation, separation, detection, conversion to electrical signals, and finally measurement of spectrum, all those steps are absolutely essential. At that time in 1980’s, it was essential to research and develop all such devices in parallel.
It can be said that various cutting-edge products and parts made in Japan, represented by examples such as Vacuum Metallurgy, Hamamatsu Photonics, Sony, and Hitachi, played an extremely important role in those devices.
9. What is the Laser Ionization MS that the Shimadzu Group has commercialized?
Since the announcement of the LAMS-50K as a laser ionization MS product in 1988, the Shimadzu Group has been producing a wide variety of products for over 35 years.
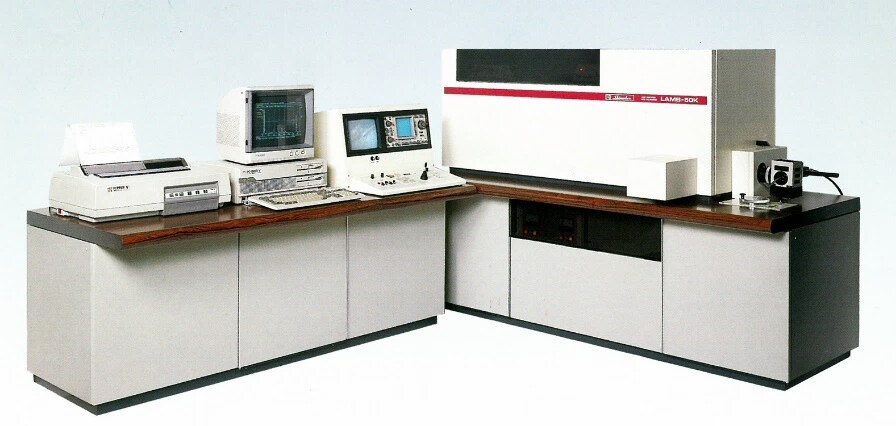
LAMS-50K (released in 1988)
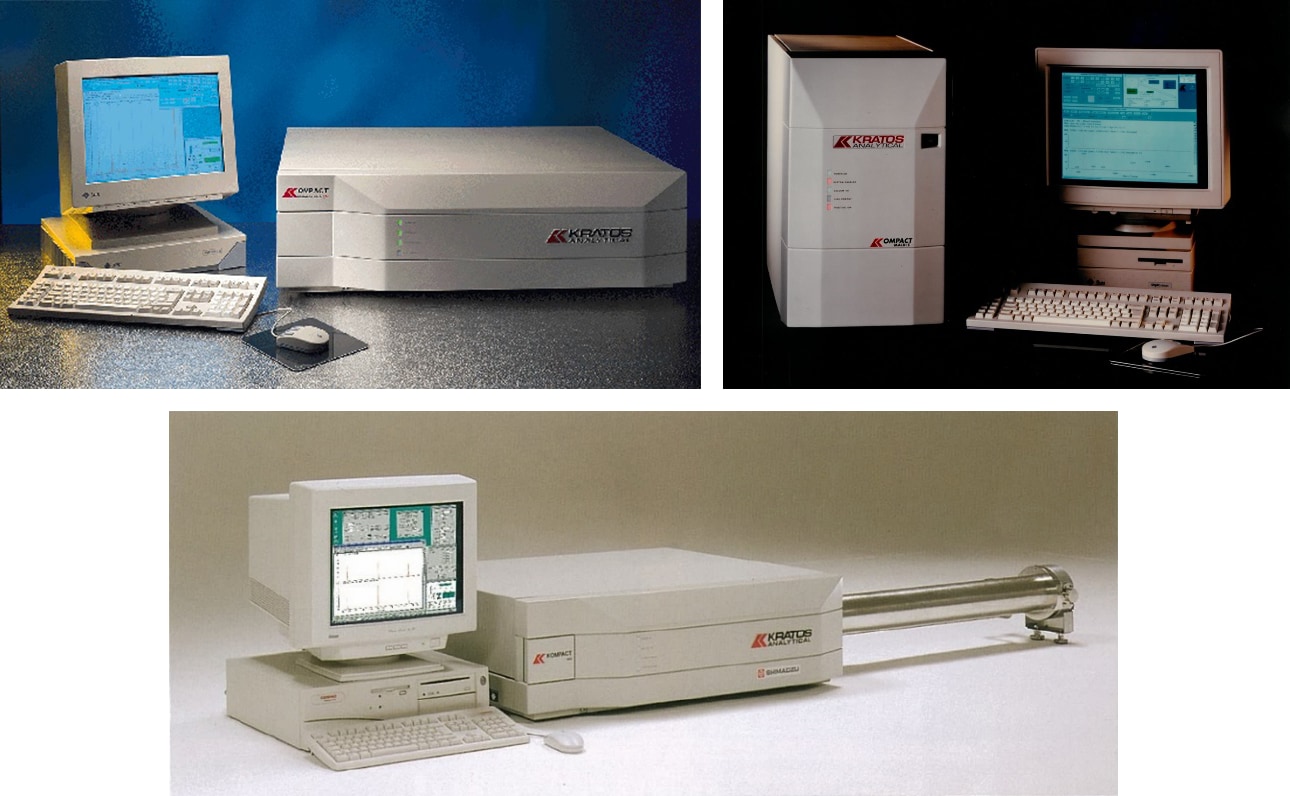
KOMPACT MALDI series (1992~1999)
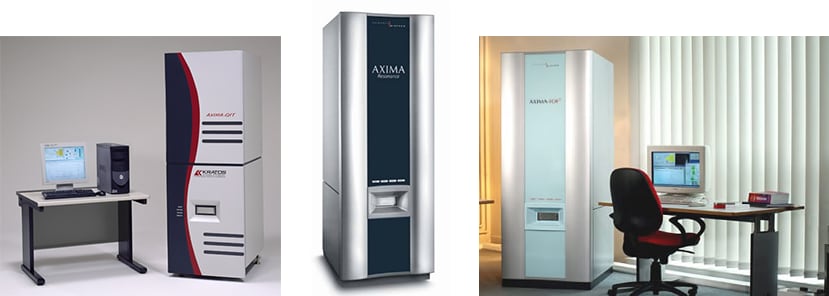
AXIMA series (1999~)
iMScope (2013~)
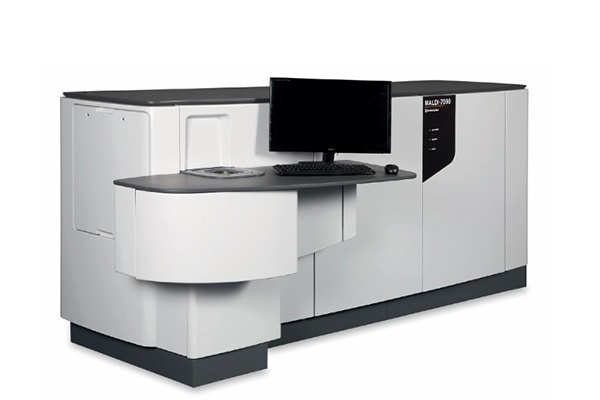
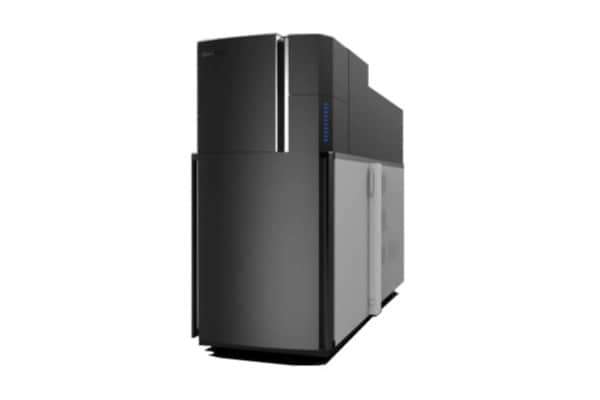
MALDI-7090 (2013~)
MALDI-8020/8030 (2020~)
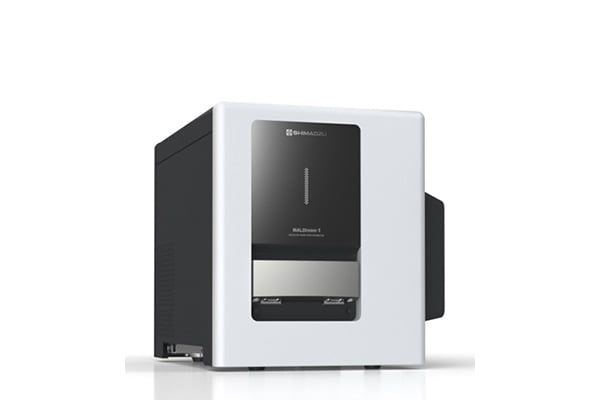
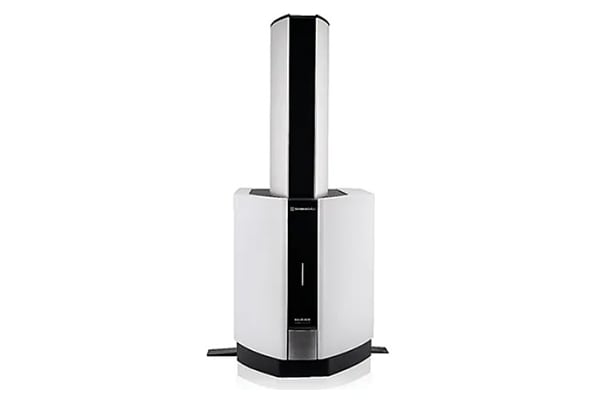
MALDImini-1 (2019~)
Mass spectrometry (MS) is a method of measuring the 'weight of compounds', a fundamental unit of physics.
Since the basic principle was invented in the early 20th century, researchers and engineers around the world have dramatically improved basic performances such as sensitivity, resolution, and accuracy. At present, its applications cover a wide range of fields, and it is expected to continue to expand into various areas in the future.