Tips for ICP-MS Analysis
1. Setting the Optimum Mass Number
Selecting the optimum mass number and analysis conditions to ensure only the targeted analyte ion intensity is measured at a given m/z is extremely important. There are a number of guidelines to follow for selecting the appropriate isotope of an analyte element. First, check the relative abundance of isotopes of that element. The highest abundance, naturally occurring isotope will normally give a higher sensitivity since the ion intensity of the detected element isotope depends on the relative abundance of that isotope. However, this assumes no interference from other elements, polyatomic or doubly charged species. If there is interference at that m/z, try to choose the next most abundant isotope, and so on.
For example, while the most abundant Cd isotope is detected at a mass number of m/z = 114, measurements at this mass number are affected by isobaric interference from Sn. If Sn is present in the sample matrix, then measurements must be performed at m/z = 111 to avoid isobaric interference while still offering high-sensitivity (high relative abundance) measurements. Similarly, selecting a mass number that experiences minimal interference is also advisable for interference from polyatomic ions and doubly charged ions.
In cases when interference cannot be avoided, it should be removed by a collision/reaction cell or corrected for (inter-element correction, half-mass correction, and interference correction equations). It is important to know the type of interferent to best correct for it. Collision gas may have little to no effect on isobaric interference and such gasses are not generally effective on some doubly charged species. Reaction gasses can be useful to mitigate some of dubly charged species but may also affect the element of interest. Half mass corrections have no effect on polyatomic interferences. In sum, interference correction takes some user knowledge and experience, but the total mass profile can be very helpful in trying to determine the source of the interferent.


2. Selecting the Cell Gas
The cell gas must also be selected for a given analyte and its corresponding influence. As mentioned in section Collision/Reaction Cell, performing analysis in collision mode with inert He gas does not cause any secondary reactions and should provide effective polyatomic interference removal for most target analyte elements regardless of the matrix elements in the sample. Low mass analyte elements are the exception to this as they lose a large amount of energy from collisions with He due to the similar mass. This energy loss causes a substantial reduction in measurement sensitivity since many ions will subsequently be removed by the kinetic energy barrier. He gas collision mode is occasionally used with low mass analyte elements when there is a high sample concentration or when the sensitivity requirements are low, but low mass elements are typically analyzed in a "no gas mode" without He using a vented cell gas.
Given that H2 effectively removes interferences derived from argide polyatomics, H2 cell gas is used when measurement sensitivity must be greater than that achievable in He collision mode. Hydrogen cell gas is also reasonably effective when spectral interferences from doubly charged ions must be removed.
While other reaction gasses exist, a combination of He and H2 is effective for most interferences encountered in ICP-MS. Some common elements measured in environmental samples and their corresponding cell gas conditions are provided as examples below. Boron (B) is measured in "No Gas mode" due to its low mass number. Be is used as an internal standard element with B and measured in "No Gas mode". Elements such as Na and Al are sometimes analyzed with He cell gas due to the sensitivity required and the impact of interference on analysis. Se and Fe are measured using H2 cell gas which effectively removes the Ar-Ar and Ar-O interferents.

3. Important Checks for Calibration Curves
Analysis by ICP-MS relies on accurate generation of calibration curves. The following four checks should be performed when calibration curves are used for quantitative analysis. While ICP-MS is capable of highly sensitive measurements, the lower the analyte concentration, the greater the risk of contamination and element instability in solution. When there is an issue with the linearity of a calibration curve (especially on the lower end), the analyst must determine whether the issue is caused by the sample preparation process or the ICP-MS and take appropriate measures based on this determination.
Important Checks
- Is there contamination?
- Blank sample: Check for contamination in the sample introduction system by running a clean blank and determine if a signal is detected
- Non-blank samples: Check the RSD (relative standard deviation)
If the RSD is poor
→ Recalibrate the equipment or perform maintenance on the sample introduction system - Is the correlation coefficient (r) of the calibration curve at least 0.999?
- When measurements are repeated due to an r below 0.999 but the curve remains the same, you should prepare calibration samples again
→ Possible pipetting mistake, contamination during sample preparation, or other sample preparation error: Consider if the same issue may have affected your samples as well. - Do the lower concentration data points also fall on the concentration curve?
- Compare set (known) concentrations with concentrations re-calculated from the calibration curve
Because the calibration curve is created using a least squares method, small errors at the high concentration end of the curve are magnified towards the low concentration end of the curve.
Wide concentration ranges require special attention.
→ Consider dividing or weighting the calibration curve - Is the sensitivity sufficient across the entire concentration range of the calibration curve?
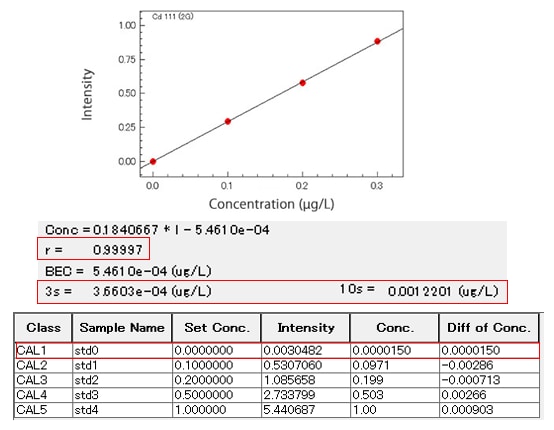
- Check the detection limit (3σ) and lower limit of quantitation (10σ) calculated based on the repeated analysis of blank samples

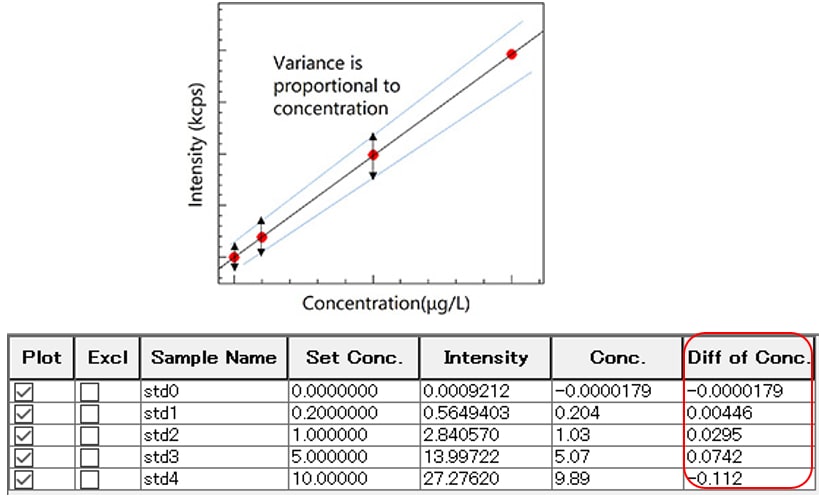
Using the least squares method creates a regression line with constant variance (standard deviation: σ) at each data point. As a result, the relative error between the actual concentration of the calibration curve sample and the measured concentration based on the regression curve increases with decreasing concentration. Accuracy can be increased at lower concentrations by using weighting to make the variance proportional to concentration, reducing the error in the low concentration region.
Comparing the unweighted data and weighted data below shows that weighting the data reduces the difference between the set concentration and the concentration determined based on the calibration curve in the very low concentration region of 0 to 1 ppb.
Unweighted

Weighted (1/I)

4. Variance Check
After measurements are complete, the results from each sample are checked for variance in relation to a known standard material. If there is an abnormality, such as an RSD of 10% or more in the obtained results, even though the measurement sensitivity is sufficient, it may be possible to find the cause related to the introduction condition of the sample or the measurement conditions by the tendency of the dispersion of the quantitative value.
- No variance: Normally there is no issue, though if this result is from a blank sample, it may be due to contamination.
- Gradually decreasing: There is a memory effect (carryover) from the previous sample or the sample introduction system or cleaning liquid may be contaminated.
- Gradually increasing: It is probably that the measurement has started before the stable sample introduction state is reached. Check the sample introduction state until the measurement starts, and confirm that the sample introduction time is sufficient.
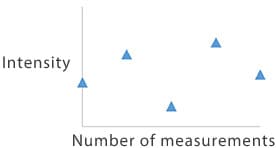
- Random variance: Blank samples usually display this type of variance due to low ion intensity. Consistent measurements as described in 1 are ideal for solutions that contain analyte elements. When random variance is observed in a solution that contains analyte elements, check whether the measurement sensitivity is sufficient at that concentration. If correcting against an internal standard, check if the variance is also present with the internal standard element and determine whether the variance is caused by the analyte element delivery or the internal standard element delivery.
Patterns of variance observed when a measurement is repeated five times in quick succession
1. No variance

Blank sample
- High intensity could be due to contamination
→ Prepare the sample again
Analyte element-containing sample
- No problem with measurements
2. Gradually decreasing

All samples
- Memory effect
- Sample introduction system or cleaning liquid is contaminated
→ Clean the sample introduction system
3. Gradually increasing

All samples
- Sample delivery is delayed because sample is not introduced properly
→ Check the delivery speed
→ Examine the peristaltic pump and tubing
4. Random variance

Blank sample
- Random variance is normal due to low ion intensity
Analyte element-containing sample
- Reduced measurement sensitivity
- Variance also apparent when analyzing internal standard element
→ Check the sample introduction system


